





TLDR
- SOL trades near $95 after five straight weekly losses and sits below its 50-, 100- and 200-day EMAs.
- Spot SOL ETFs saw $71.47 million in net outflows last week, their largest weekly withdrawals since launch.
- Whales moved $111 million of SOL to Coinbase Institutional on October 31.
- SOL has fallen about 11% since the Alpenglow upgrade went live on October 21.
- Analyst Jesse Olson says SOL is oversold, with three of four downside targets hit.
Solana (SOL) traded near $95.48 on Monday after a fifth straight weekly loss. The token has been falling since late September.
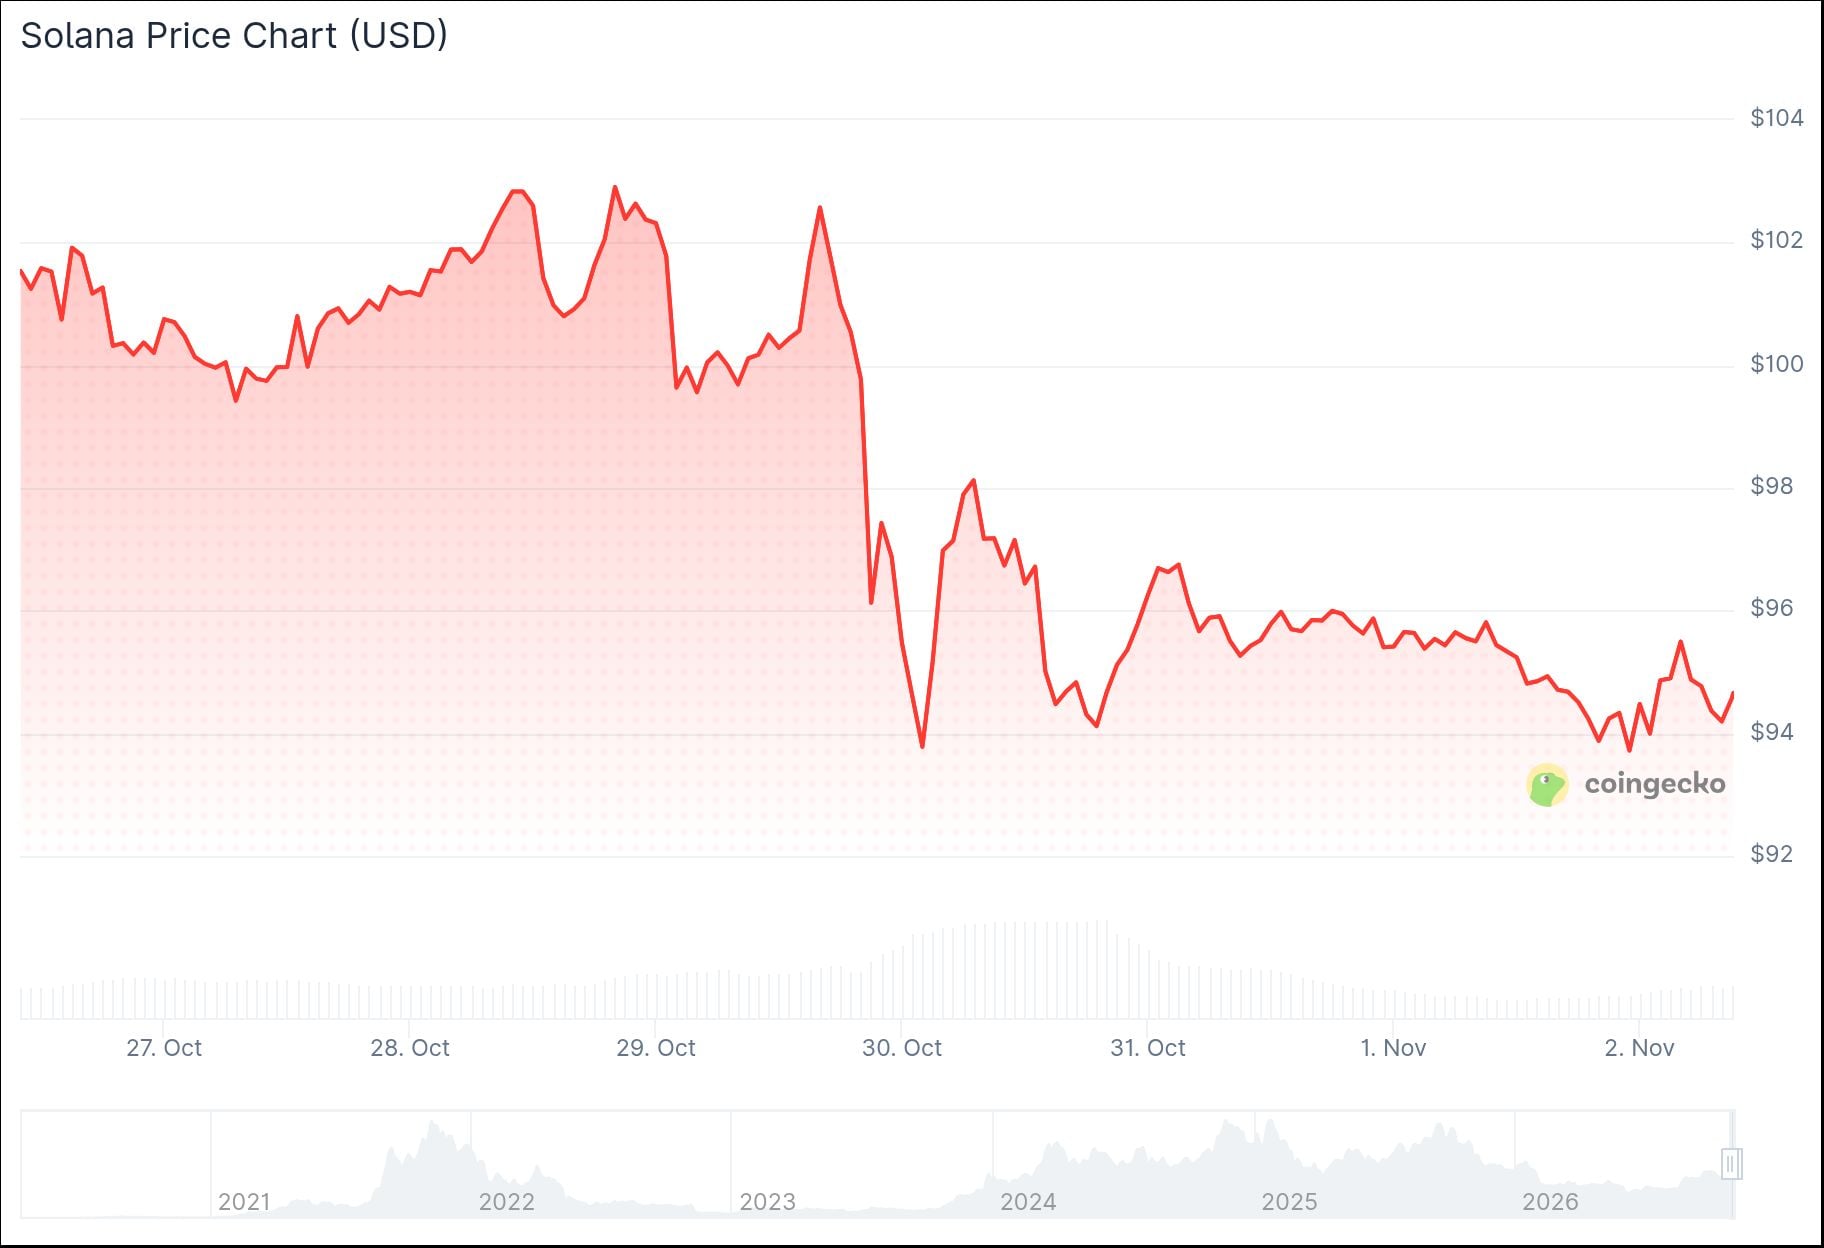
SOL is also trading below its 50-day, 100-day and 200-day Exponential Moving Averages (EMAs). These sit at $103.81, $99.96 and $98.08.
ETF Outflows Reach a Record
US-listed spot SOL ETFs recorded net outflows of $71.47 million last week, according to SoSoValue. That is the highest weekly withdrawal total since the funds launched.
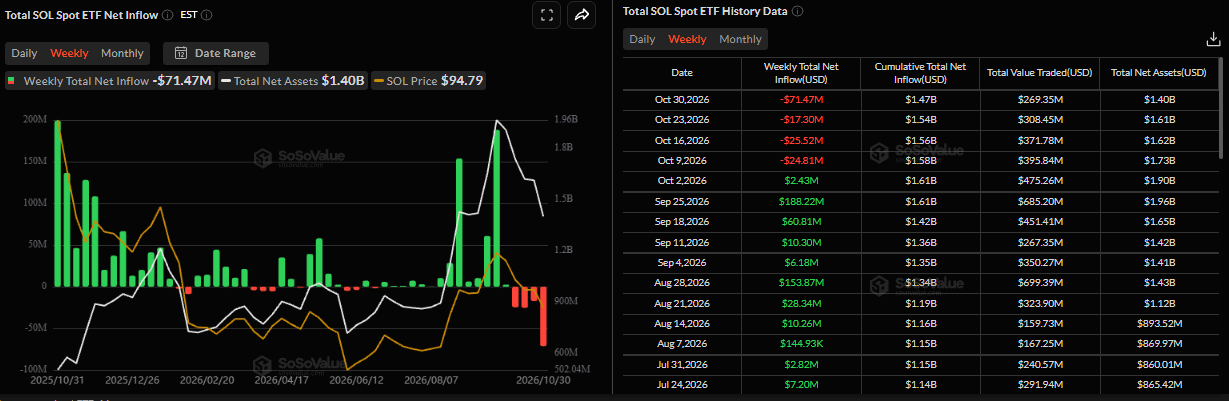
It was the fourth straight week of outflows. Investors pulled money out every day that week, peaking at $27.7 million on October 29.
Total ETF holdings fell to $1.4 billion. Net inflows since October 2 have dropped from $1.6 billion to $1.5 billion.
Whales also moved $111 million of SOL to Coinbase Institutional on October 31. CryptoQuant data shows large whale orders and sell-side dominance in both spot and futures markets.
Analyst Jesse Olson said on X that SOL remains oversold but can stay that way for a while. He noted that three of four downside targets have been hit and that he sees no other signs of a reversal yet.

$SOL continues to be oversold (blue candles) but can remain oversold.
Three out of four downside targets have been hit.
No other signs of a reversal as of yet. pic.twitter.com/JItZCVlCWx
— Jesse Olson (@JesseOlson) November 1, 2026
The Relative Strength Index (RSI) sits near 31, which points to early oversold conditions. The Moving Average Convergence Divergence (MACD) remains negative.
Price Levels to Watch
SOL has slipped back under horizontal resistance at $97.76. The 200-day EMA at $98.08 and the 100-day EMA at $99.96 come next.
The 50-day EMA at $103.81 is a stronger cap. Above that, a horizontal level sits at $122.76.
On the downside, first support is near $88.42, where a rising trendline broke. A deeper floor sits near $78.35.
SOL fell 19.3% in October and touched a 30-day low of $92. It is now about 68% below its record high of $293 from January 2025.
The Alpenglow upgrade went live on October 21. It cut transaction finality from 12.8 seconds to about 150 milliseconds.
SOL was near $107 on launch day and has since dropped about 11%. Validator votes no longer count as transactions, which could lower reported transaction numbers.
Solana often follows Bitcoin. BTC trades at $78,050, about 38% below its October 2025 high of $126,080.
Over 90 days, SOL gained 29.9% while Bitcoin rose 22.1%. Over the past year, SOL is down 48.7% and Bitcoin is down 29.6%.
Reaching $500 by the end of 2028 would require about 116% annual gains. That would put Solana’s market value near $295 billion, above Ethereum’s roughly $277 billion.
SOL last traded above $150 in November 2025, when it peaked at $189. As of Monday, it trades at $95.48.


