






TLDR
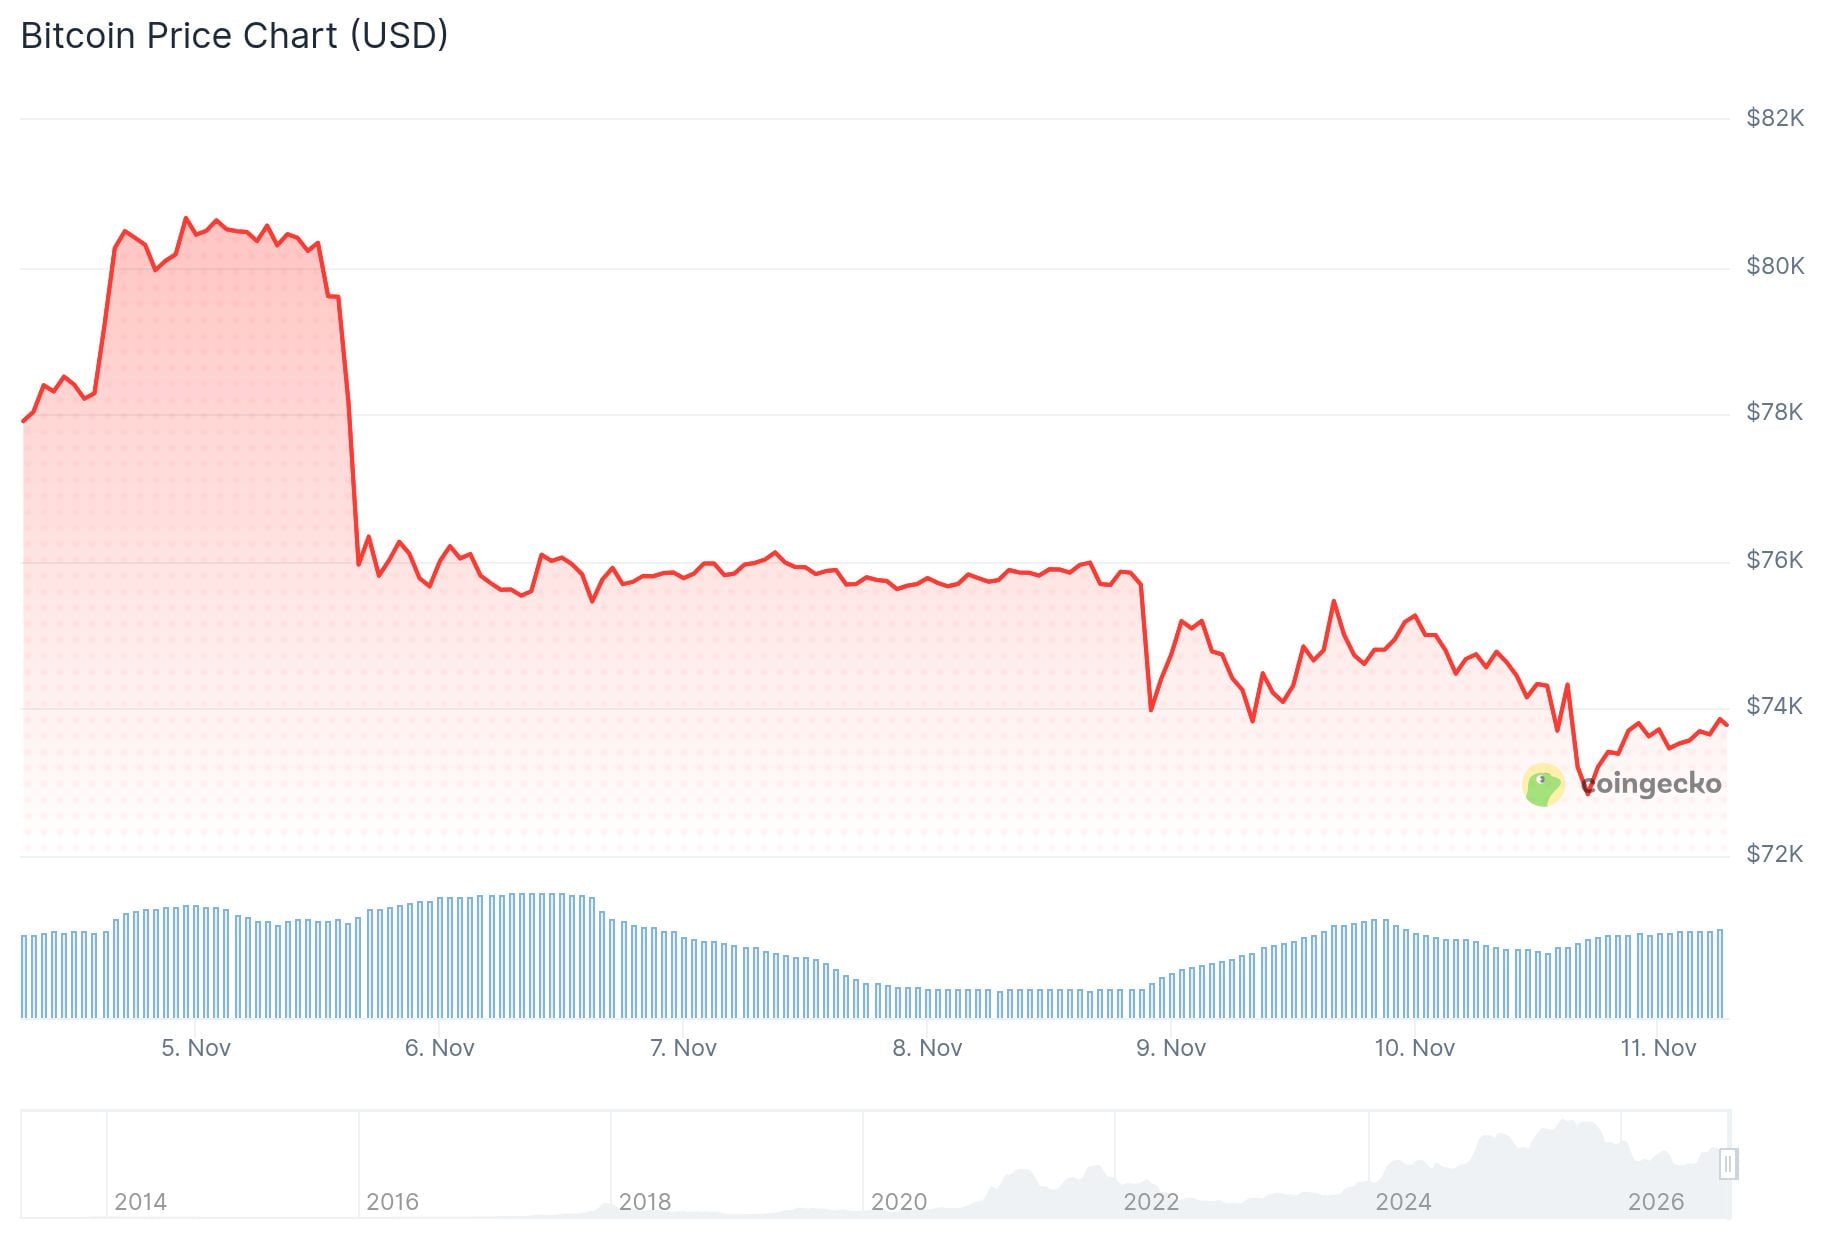
- Bitcoin fell to $73,518 on Tuesday, near its lowest level since Aug. 21.
- October CPI rose 0.4%, above the 0.3% forecast.
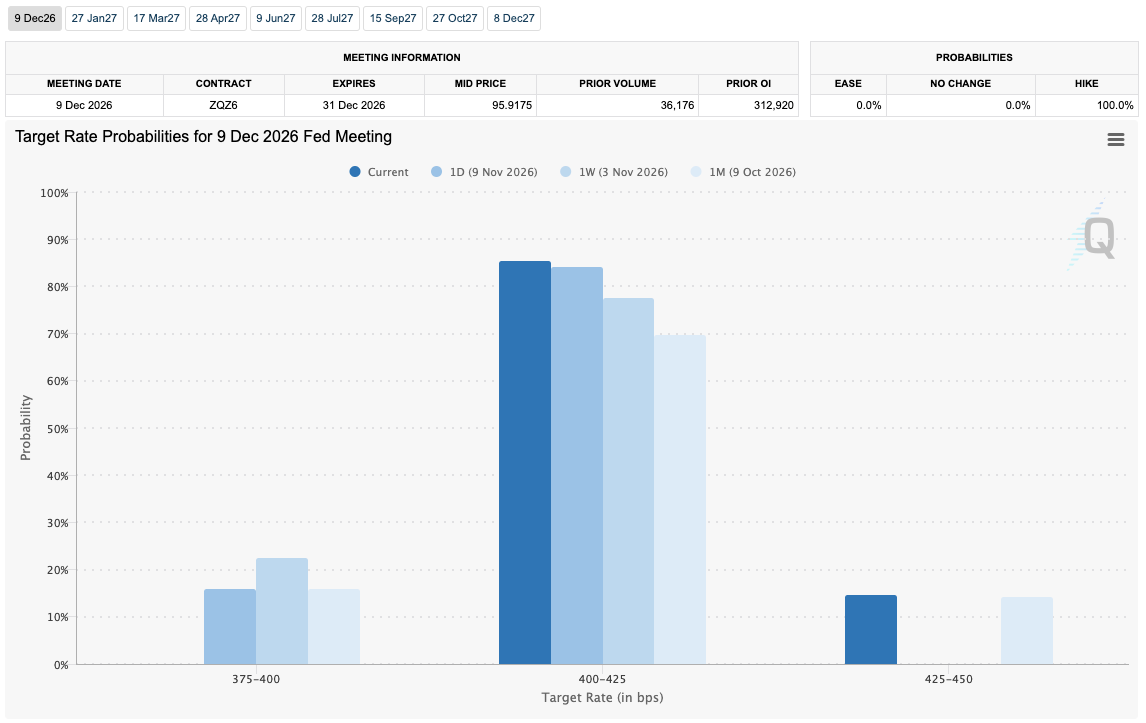
- Odds of a 25-basis-point Fed hike in December sit at 85.3%.
- Analysts are watching $73,000 and $72,000 as key support.
- 21Shares named $69,000 as the downside level and $78,000 as the retest target.
Bitcoin (BTC) fell to $73,518 on Tuesday after U.S. inflation data came in above forecasts. The price briefly returned above $74,000 but stayed close to its lowest level since Aug. 21.
October’s Consumer Price Index rose 0.4% from September, above the 0.3% forecast. Core CPI rose 0.3% against an expected 0.2%.
The report had no year-on-year figure because data was not collected during the 2025 government shutdown. Monthly growth did cool from the 0.6% rise in September.
Energy prices rose 0.7% in October after a 5.2% jump in September. The Bureau of Labor Statistics said shelter rose 0.3% and food rose 0.5%.
Fed Rate Hike Odds Shift Higher
Economist Robin Brooks called the details of the report “discouraging.” He said October was the peak of the second oil price shock this year.
Fed governor Christopher Waller said earlier Tuesday that he favors a 25-basis-point hike in December. CME Group’s FedWatch tool showed a 96.3% chance of that outcome before the data came out.
After the report, the odds of a 25-basis-point hike moved to 85.3%. A 50-basis-point hike drew 14.7%.

U.S. stocks also felt pressure. The Nasdaq Composite opened down 0.6% before recovering, and Nvidia fell nearly 4%.
Trading resource Mosaic Asset Company said the equity put/call ratio jumped above 1.0. That is higher than during the April 2025 selloff, and Mosaic said it could point to a long-term bottom for the Nasdaq.
Bitcoin Support Levels in Focus
Bitget analyst Lewis Huang said the 200-day moving average near $73,200 is a key support level. He said a sustained move below it could raise the risk of a deeper pullback.
Analyst Daan Crypto Trades said bitcoin sits where several major higher-timeframe levels meet. These include the Bull Market Support Band, the daily 200MA/EMA and the yearly VWAP, and he said $72,000 is the level to hold, with daily and weekly closes mattering most.
$BTC Here we are. Right at the level where all the major high timeframe levels come together.
– Bull Market Support Band
– Daily 200MA/EMA
– Yearly VWAP
– 2024 Summer range high/Big horizontal region
– 0.5 & 0.618 Fib retracement levels from the move upI'd be surprised if this… https://t.co/mKaPAyDeR9 pic.twitter.com/stsKIJBPVp
— Daan Crypto Trades (@DaanCrypto) November 10, 2026
Trader Heisenberg posted that the chart shows three support confluences at the current price. He told bulls it was time to buy.
$BTC Chart Update:
3 notable confluences of support right here, right now.
Bulls, you know what to do.
Buy. pic.twitter.com/OlUThSJjTY
— Heisenberg (@Mr_Derivatives) November 11, 2026
Matt Mena of 21Shares said $73,000 sits near bitcoin’s pre-election 2024 all-time high and its April 2025 lows. A sustained break below it could send BTC toward $69,000, close to the 2021 cycle high.
Mena also pointed to the 50-week moving average as support. A break there could pressure Ethereum’s $2,000 level, with $1,800 the next one to watch.
If $73,000 holds, 21Shares sees a possible retest of $78,000, with $85,000 in reach by year-end. November has averaged a 34.4% return for bitcoin since 2010, with a median gain of 8.6%.
Paul Howard of Wincent said derivatives and hedging tools are changing bitcoin’s volatility profile. Without a shift in policy, regulation or institutional flows, he said a gradual downward drift is more likely than a rally toward $100,000.
Ether fell 3.7% to $2,042, and Solana dropped more than 4% to trade below $83. Bitcoin was trading at $73,363, down 1.6%, at the time of reporting.


