






TLDR
- Bitcoin traded near $73,560 during the November 12 technical snapshot.
- Bitcoin’s 200-day simple moving average stood near $73,147.
- The daily RSI measured 33.9, remaining above the conventional oversold threshold of 30.
- Technical resistance stood near $74,659, followed by another barrier at $76,590.
- Bitcoin would need approximately 35% appreciation from $74,000 to reach $100,000.
Bitcoin (BTC) price is testing a crucial support cluster near $73,000 while its daily momentum remains weak. As per recent analysis by @CryptoGerla on X, Bitcoin’s price is near an ascending channel drawn from June. Independent indicators show a support test, not a confirmed rebound toward $100,000.
$BTC is testing the channel support that has held since June. RSI is back near oversold levels, just like the previous bounce zones.
$100K is still the bigger target. pic.twitter.com/q3dYG4Ozjh
— Joep Gerla (@CryptoGerla) November 12, 2026
CoinGecko recorded a November 11 closing price of $73,974, following $73,721 on November 10. A November 12 market snapshot placed Bitcoin around $73,560 at 08:30 UTC. The price remained near its longer-term average and below immediate resistance.
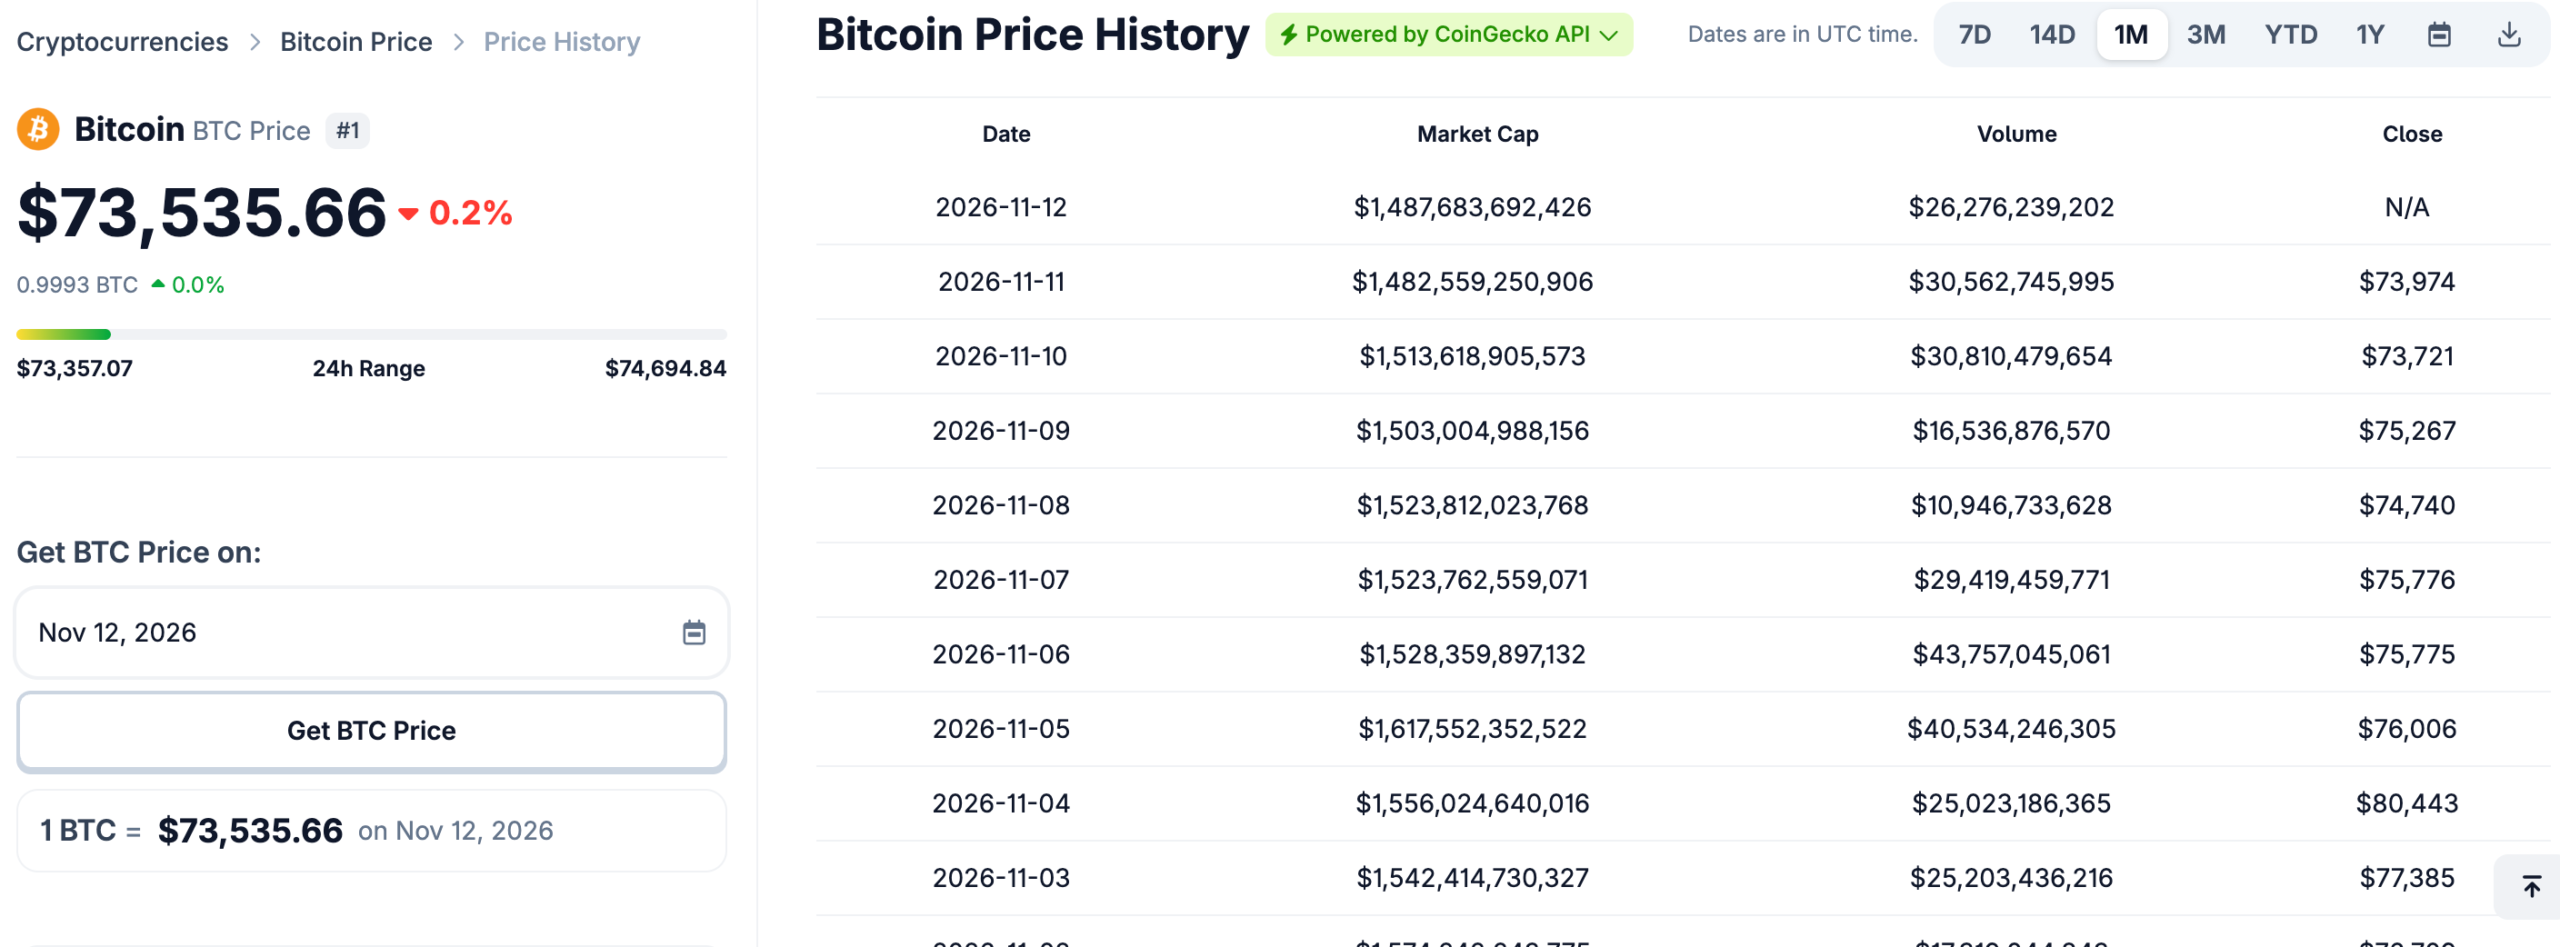
Source: CoinGecko
Why the $73,000 Area Matters
A November 12 technical snapshot placed Bitcoin’s 200-day simple moving average at $73,147. The same analysis identified nearby support at $73,548 and initial resistance at $74,659. It placed further downside levels at $72,466 and $71,632.
These figures reflect calculations based on historical prices, not guaranteed market turning points. The proposed channel boundary also requires confirmation of its exact coordinates and chart timeframe. Its apparent overlap with a moving average does not independently validate the trendline.

RSI Has Not Confirmed an Oversold Reversal
Researcher Axel Adler Jr. recorded Bitcoin’s daily RSI falling from 50.64 on November 4. It reached 34.01 on November 10, before recovering to 34.98 on November 11. A separate November 12 snapshot put the indicator at 33.9.
Readings below 30 typically indicate oversold conditions, although even those readings cannot predict rebounds. The current reading therefore shows weak momentum without confirming an oversold reversal.
Adler’s records show RSI last entered oversold territory between June 2 and June 10. That history offers context, but does not establish another rally’s probability.
Other indicators remain cautious. The November 12 snapshot showed a negative daily MACD histogram near -350. Bitcoin also traded below its 50-day simple moving average near $80,988.
What Would Strengthen the $100,000 Scenario?
The $100,000 level remains a proposed price objective rather than a verified market forecast. From approximately $74,000, Bitcoin would need to gain roughly 35% to reach that level.
Before that, resistance sits near $74,659 and $76,590, according to the same snapshot. Previous reporting also identified $78,000 as a possible recovery checkpoint. These nearer barriers offer measurable tests before a six-figure outcome.
Investment manager 21Shares identified $80,000 and 81,000–82,000 as overhead reference levels on November 3. The firm linked those zones to treasury-company and US ETF acquisition costs.
Those cost references do not establish whether Bitcoin will reach them. A sustained move below the support area would weaken the channel-based recovery argument. Conversely, reclaiming resistance with improving momentum would strengthen the case for stabilization, without guaranteeing $100,000.


