


 Price: Analyst Warns ETH Could Revisit Its Lows — Here Are the Levels That Matter")


TLDR
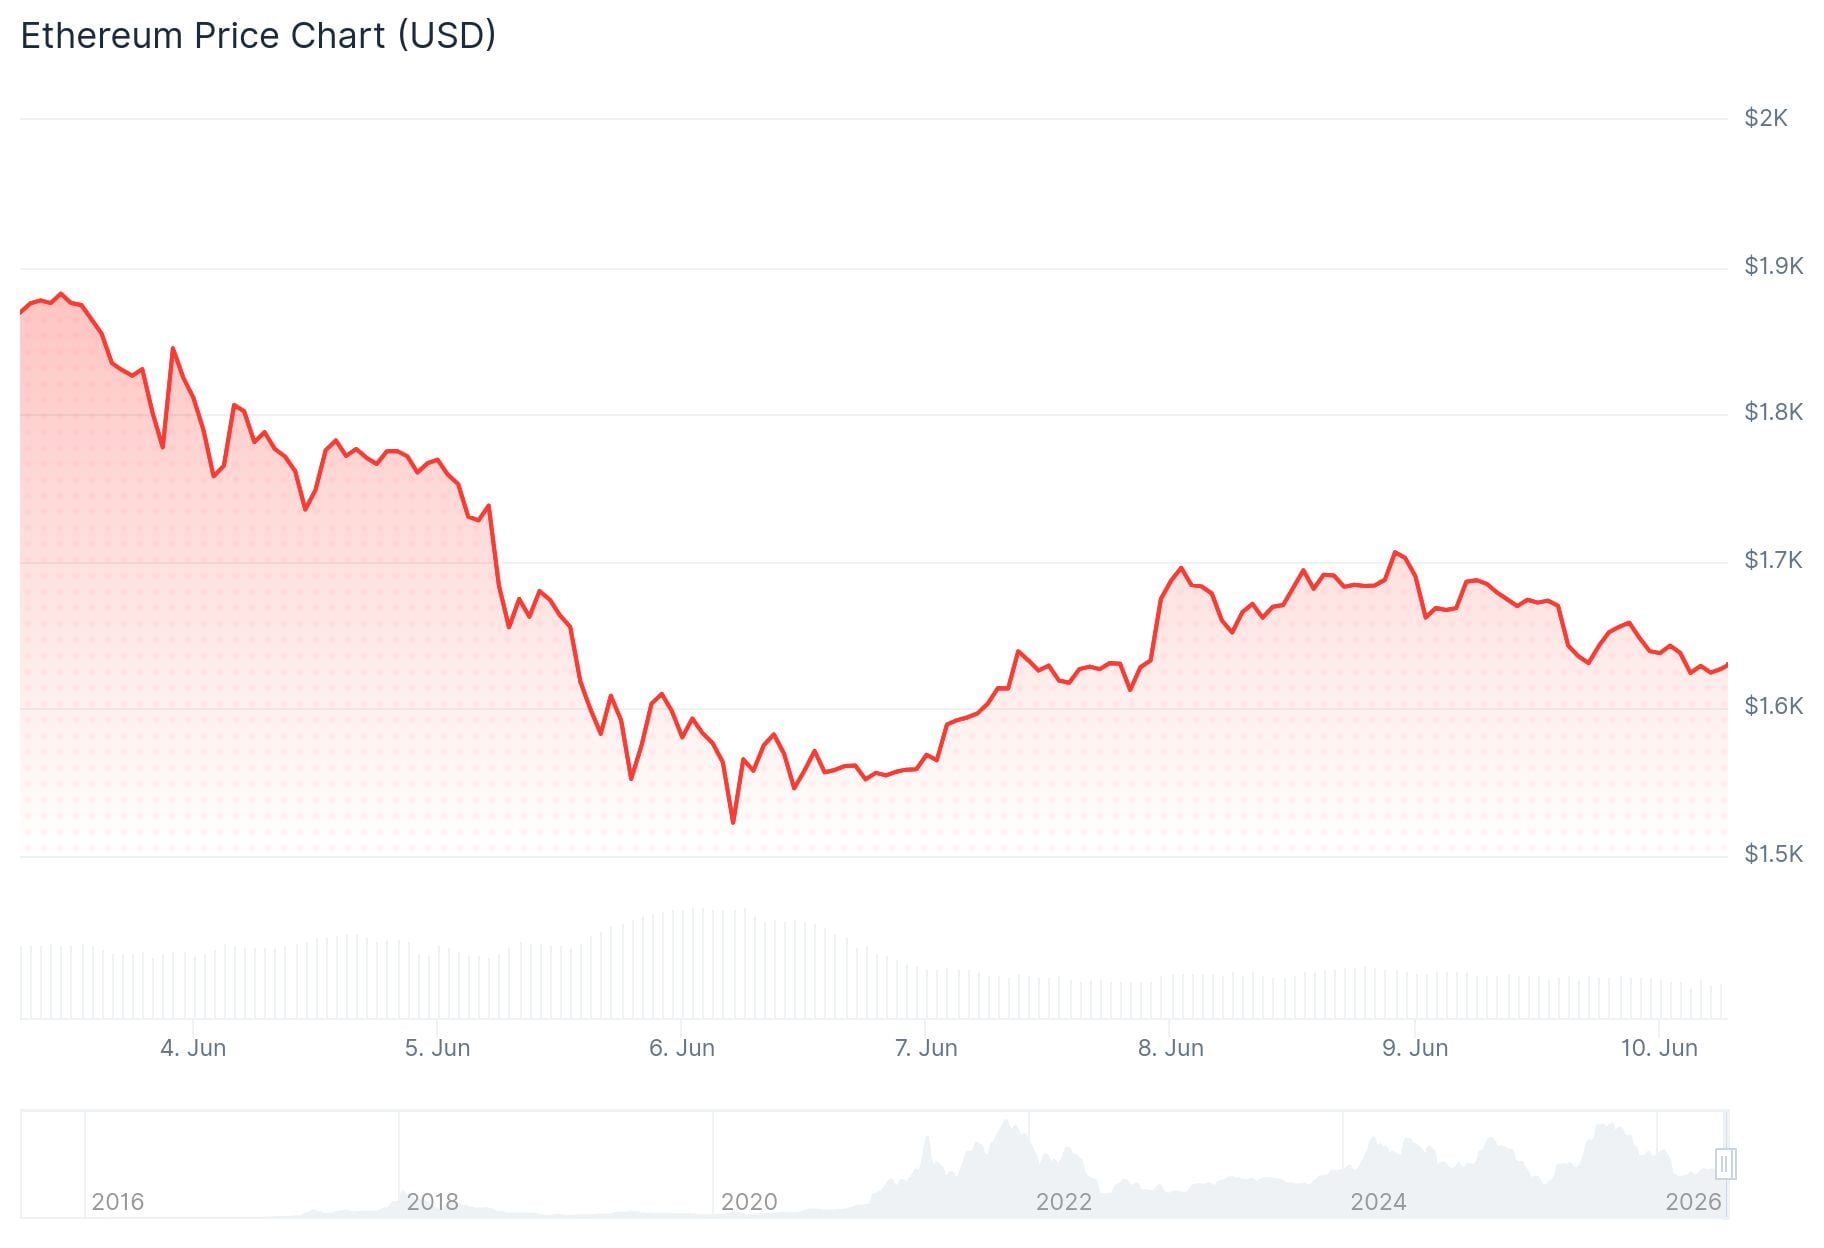
- ETH dropped 4% in 24 hours to around $1,628
- $1,700 has flipped from support to resistance after February 2026 lows
- $1.1 billion in crypto liquidations hit the market in one day
- ETF data showed $91.37M outflows from Bitcoin ETFs vs $82.37M inflows to Ethereum ETFs
- Failure to hold $1,600 could send ETH back toward $1,500
Ethereum is trading around $1,628 after a 4% drop in 24 hours. The move came as the broader crypto market fell 3.46%, bringing total market cap down to $2.12 trillion.
Bitcoin also took a hit, dropping from $64,100 to around $61,049. The decline triggered over $1.1 billion in liquidations across the crypto market in a single day.
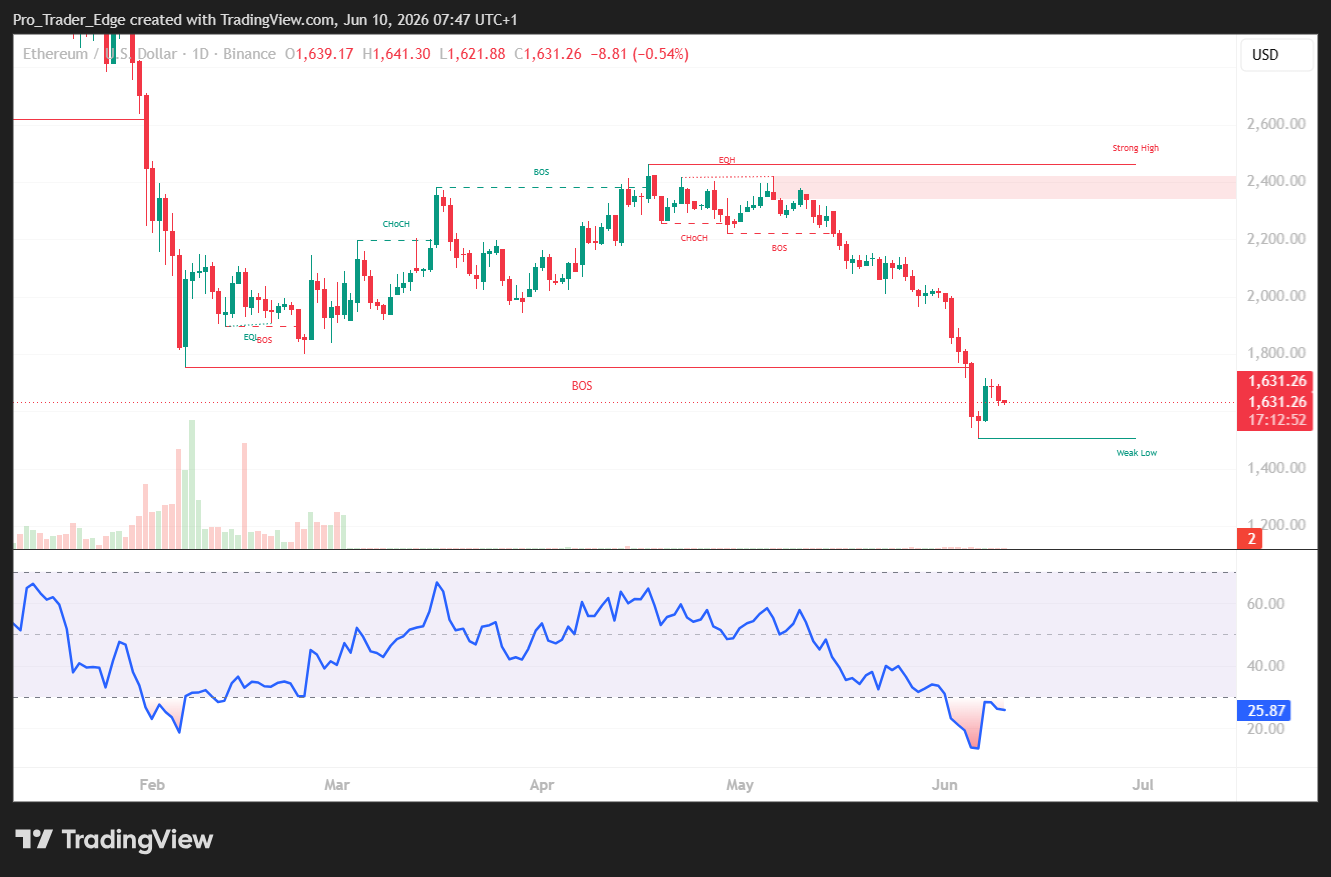
Analyst Ted (@TedPillows) pointed out that $1,700 is now acting as resistance for ETH. This was the same zone where Ethereum bottomed in February 2026, but it has since flipped and sellers are now defending it.
$ETH is trying to reclaim the $1,700 level.
This is the zone where Ethereum bottomed in Feb 2026 and is now acting as a resistance.
If ETH fails to reclaim this, a sweep of lows could happen next. pic.twitter.com/e6qx6vSPJj
— Ted (@TedPillows) June 9, 2026
Ted warned on X: “$ETH is trying to reclaim the $1,700 level. This is the zone where Ethereum bottomed in Feb 2026 and is now acting as resistance. If ETH fails to reclaim this, a sweep of lows could happen next.” His chart pointed to $1,540 as a potential downside target.
The selling pressure was broad. XRP dropped below $1.15, showing the move was not isolated to ETH or BTC. Traders pointed to weak risk sentiment and heavy leveraged positions being unwound.
$ETH Good initial bounce and okay weekly close all things considered.
Bulls now need to retake $1750 to change the ongoing pattern of breakdowns, bearish retests and new lows.
I would consider retaking $1750 a sign of strength and would start targeting that major $2.1K area… https://t.co/m0ltHMPzv8 pic.twitter.com/9mcoWkrZ7X
— Daan Crypto Trades (@DaanCrypto) June 9, 2026

Liquidation Data Points to Further Volatility
Analyst CryptoReviewing flagged a striking imbalance in the one-day liquidation map: $331 million in long positions versus $1.84 billion in short positions. That is a 5.5x difference, which could fuel sharp moves if prices reverse quickly.
Bitcoin ETFs saw $91.37 million in net outflows on June 8, according to SoSoValue data. Ethereum ETFs, however, recorded $82.37 million in net inflows on the same day, per Wu Blockchain on X.
On the 4-hour chart, Ethereum was trading at $1,644 at the time of writing. The RSI sits at around 43.21, showing weak momentum. The Chaikin Money Flow indicator is near 0.05, pointing to mild buying interest but nothing strong.
Key Price Levels to Watch
The first upside target is $1,700. A clean break above that opens the door to $1,800, which analysts say would improve market sentiment.
A move above $1,800 could then bring $2,000 into play as the next resistance zone.
On the downside, $1,600 is the level to watch. If ETH loses that support, a retest of $1,500 becomes likely.
At the time of reporting, ETH was holding just above $1,600 with momentum indicators still leaning bearish.


