






TLDR
- Ethereum trades at $2,289.88, up 1.62% in 24 hours
- ETH needs to reclaim $2,300, with resistance at $2,388.64
- ETH/BTC broke above a descending trendline on Nov. 3
- Open interest fell from about $34B to about $28B since early October
- U.S. spot Ether ETFs saw $139.7M in net outflows on Nov. 2
Ethereum (ETH) is trading at $2,289.88, up 1.62% over the last 24 hours. The price sits just below the $2,300 level that traders are watching.
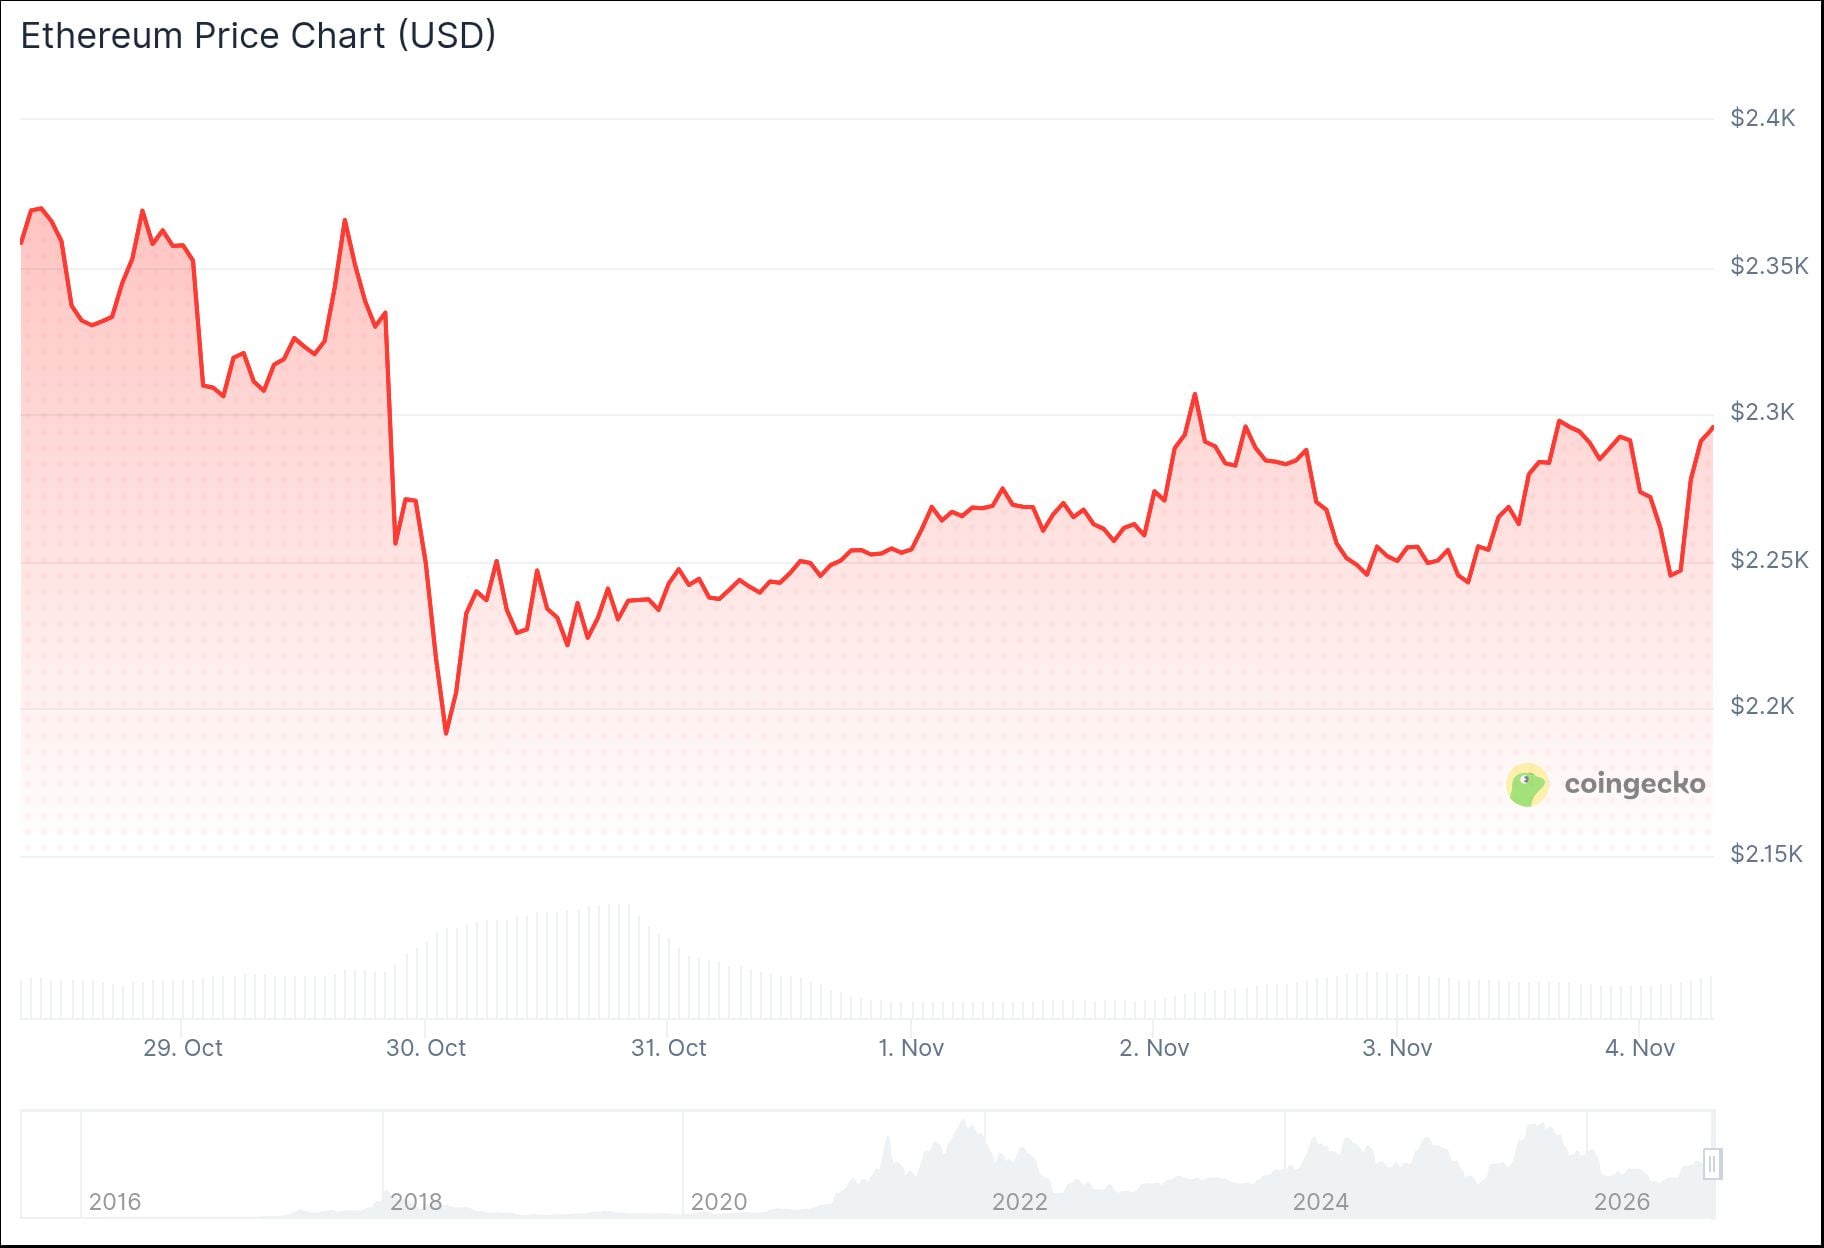
CoinGecko’s Nov. 3 data put ETH’s 24-hour range between $2,235.31 and $2,301.63. The seven-day range ran from $2,178.62 to $2,384.72.
ETH rebounded above $2,250 on Nov. 1, gaining 1.12% to nearly $2,270. Bitcoin approached $78,000 that day.
Analyst Ted Pillows said on X that Ethereum has been “holding up well” in recent days. He added that “buyers are stepping in.”
Now is the time for $ETH to start its reversal.
In the past few days, Ethereum has definitely been holding up well, which indicates buyers are stepping in.
Now, ETH needs to reclaim $2,300 for a decent rally. pic.twitter.com/6WgkgbUc0T
— Ted (@TedPillows) November 3, 2026
Pillows named $2,300 as the key level. He wrote that “ETH needs to reclaim $2,300 for a decent rally.”
Ethereum Price Levels and Indicators
The daily TradingView chart shows ETH below resistance at $2,388.64. The latest daily candle is green, but there is no breakout above that zone yet.

If buyers reclaim $2,388.64, the next resistance sits near $2,620.64. The $2,200 area remains the support level to watch.
The MACD line is at -67.20 and the signal line is at -63.75. The histogram reads -3.45, so bearish momentum has not fully faded.
The analyst known as BATMAN posted that MACD is curling up toward a bullish crossover. He added that a daily close above the 200 EMA could shift momentum to the upside.
$ETH is showing bullish signs, with MACD curling up toward a bullish crossover.
A daily close above the 200 EMA could trigger a shift in momentum to the upside. pic.twitter.com/3azufxEyD7
— BATMAN ⚡ (@CryptosBatman) November 3, 2026
CoinGlass data shows open interest fell from about $34 billion in early October to about $28 billion on Nov. 3. The latest daily candle also recorded about 126.9K in volume.
Ethereum Gains Against Bitcoin as ETF Outflows Continue
ETH/BTC traded near 0.02955 on Max Crypto’s Binance daily chart. The pair moved above a descending resistance line drawn from earlier highs above 0.033.
ETH/BTC downtrend is now over.
GIGA BULLISH FOR ALTS. pic.twitter.com/aVyrPnJ1cR
— Max Crypto (@MaxCrypto) November 3, 2026
“ETH/BTC downtrend is now over,” Max Crypto wrote. He described the move as bullish for altcoins.
Ash Crypto pointed to a longer-term rising support line tied to the 2025 bottom. He wrote that ETH/BTC closed above it despite a red October, and that a bounce above key resistance is needed to confirm strength.
Michaël van de Poppe said Ethereum looks “pretty decent” but still needs to break a crucial resistance zone. He said he remains fully allocated and expects altcoins to outperform, driven by ETH.
Trader il Capo compared the latest pullback to Ethereum’s 2025 retracement. He wrote that it started at the same resistance and stopped at the same support, and he expects a bullish continuation.
U.S. spot Ethereum ETFs recorded $139.7 million in net outflows on Nov. 2, according to Farside Investors. BlackRock’s ETHA accounted for $138.3 million of that total.
Combined net withdrawals reached $571.1 million over the six sessions from Oct. 26 through Nov. 2. Every session finished negative, including $155.7 million on Oct. 30.


