






TLDR
- ETH fell 2.84% to around $2,670 on Sep. 23 after a rejection near $2,789
- The day’s low hit $2,648, with key support levels at $2,626 and $2,550
- Open interest stayed near 13 million ETH, showing limited leverage activity
- US spot Ethereum ETFs pulled in $432.2 million over two consecutive days (Sep. 21–22)
- ETH remains above longer-term moving averages despite the short-term pullback
Ethereum dropped below $2,700 on September 23 after failing to push past the $2,800 level. The price hit a session low of $2,648 before stabilizing around $2,670.
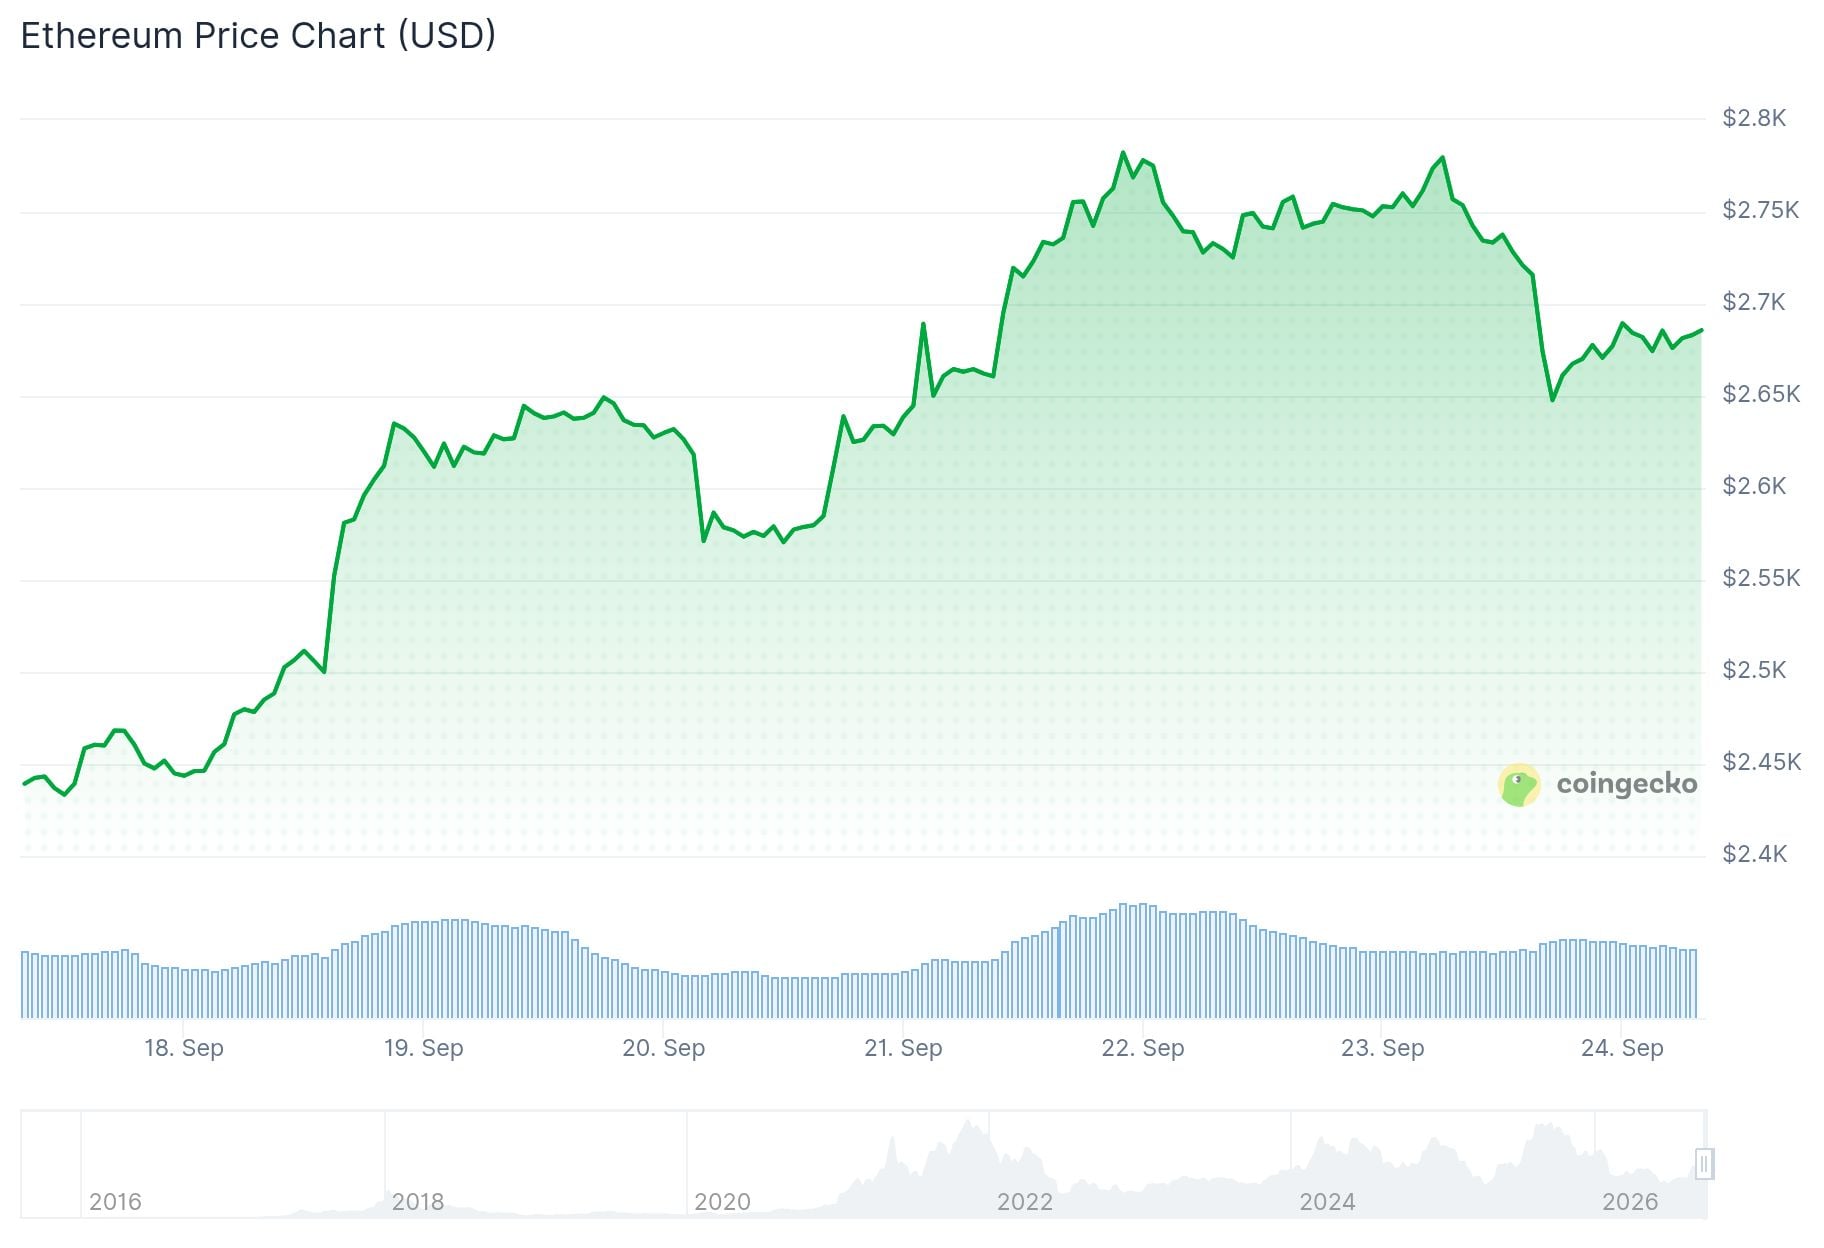
The move reversed a rally that started in mid-September from around $2,400. ETH broke above former resistance at $2,550 and climbed toward $2,789 before sellers stepped in.
ETH had opened the session near $2,754 and reached a high of approximately $2,789. The rejection came quickly, with price falling through the short-term moving average at $2,710.
Despite the drop, ETH still trades above its 4-hour 50-, 100-, and 200-period moving averages, sitting at $2,586, $2,540, and $2,499 respectively. Those averages reflect how far the rally had carried the price before Wednesday’s retreat.
ETF Inflows Remain Strong
US spot Ethereum ETFs saw strong demand going into the pullback. Farside Investors recorded $270 million in net inflows on Sep. 21 and $162.2 million on Sep. 22, bringing the two-day total to $432.2 million.
🐋 WHALE WATCH :BlackRock ETF clients just scooped up $50.8 MILLION worth of $ETH in a single day!
The smart money isnt waiting for a dip tradfi giants are aggressively stacking Ethereum.$BTC brought Wall Street to crypto but $ETH is where institutional capital builds.
Are… pic.twitter.com/EY5soVGi8R
— Whale Factor (@WhaleFactor) September 24, 2026
The next flow report will show whether buying continued as ETH pulled back from $2,800.

Crypto trader Ted Pillows flagged $2,550 as ETH’s largest liquidity cluster, suggesting the token could revisit that level before any move higher. He also noted that a whale purchased $119.67 million worth of ETH in a single day, describing it as accumulation.
A whale bought $119,670,000 in $ETH today.
Accumulation. pic.twitter.com/BcGafhbCK5
— Ted (@TedPillows) September 23, 2026
That $2,550 area sits close to the 4-hour 100-period moving average at $2,540 and a key retracement level at $2,532. These levels would come into focus only if ETH breaks below the Sep. 23 low of $2,648.
Open Interest and On-Chain Activity
Open interest in ETH derivatives has stayed near 13 million ETH since late August. In USD terms, ETH’s price rose 70% from its June low, while open interest grew 60% to $34.8 billion — a gap that shows leveraged traders have been cautious.
Network activity has not grown alongside price. Active addresses and transaction counts on mainnet have been flat or declining over the past three months.
ETH recorded roughly $119 million in liquidations over the past 24 hours. Long liquidations made up $95.8 million of that total, per Coinglass data.
$ETH – Original squiggles still spot on. This is where I want to call it good and delete the rest but will leave them. Hopefully we don't have a lower fakeout still on the table. pic.twitter.com/iY6JRnx27a
— IncomeSharks (@IncomeSharks) September 22, 2026
Daily momentum indicators still lean positive. MACD stood above its signal line at 96.80 versus 83.87, and Aroon Up was 85.71% compared to Aroon Down at 42.86%.
A CoinGlass liquidation heatmap shows clusters near $2,700 and $2,650 — levels that could face pressure if selling continues.
ETH would need to reclaim $2,710 and then $2,789 to put the $2,800 breakout attempt back in play. The most recent low at $2,648 remains the nearest level to watch on the downside.


