






TLDR
- Ethereum (ETH) dropped below $2,600 on October 7, falling 5.67% in a single day.
- Long liquidations hit $201 million, the highest since June 5.
- ETH is testing its 100-week EMA near $2,561, a level analysts say is critical.
- Ethereum ETFs saw $252 million in weekly outflows, the largest since June.
- Geopolitical tension near the Strait of Hormuz added to the broader market sell-off.
Ethereum (ETH) price fell under $2,600 on October 7, extending a sharp pullback that has rattled traders across the crypto market. The token traded near $2,555 at the time of writing, down 5.67% for the day.
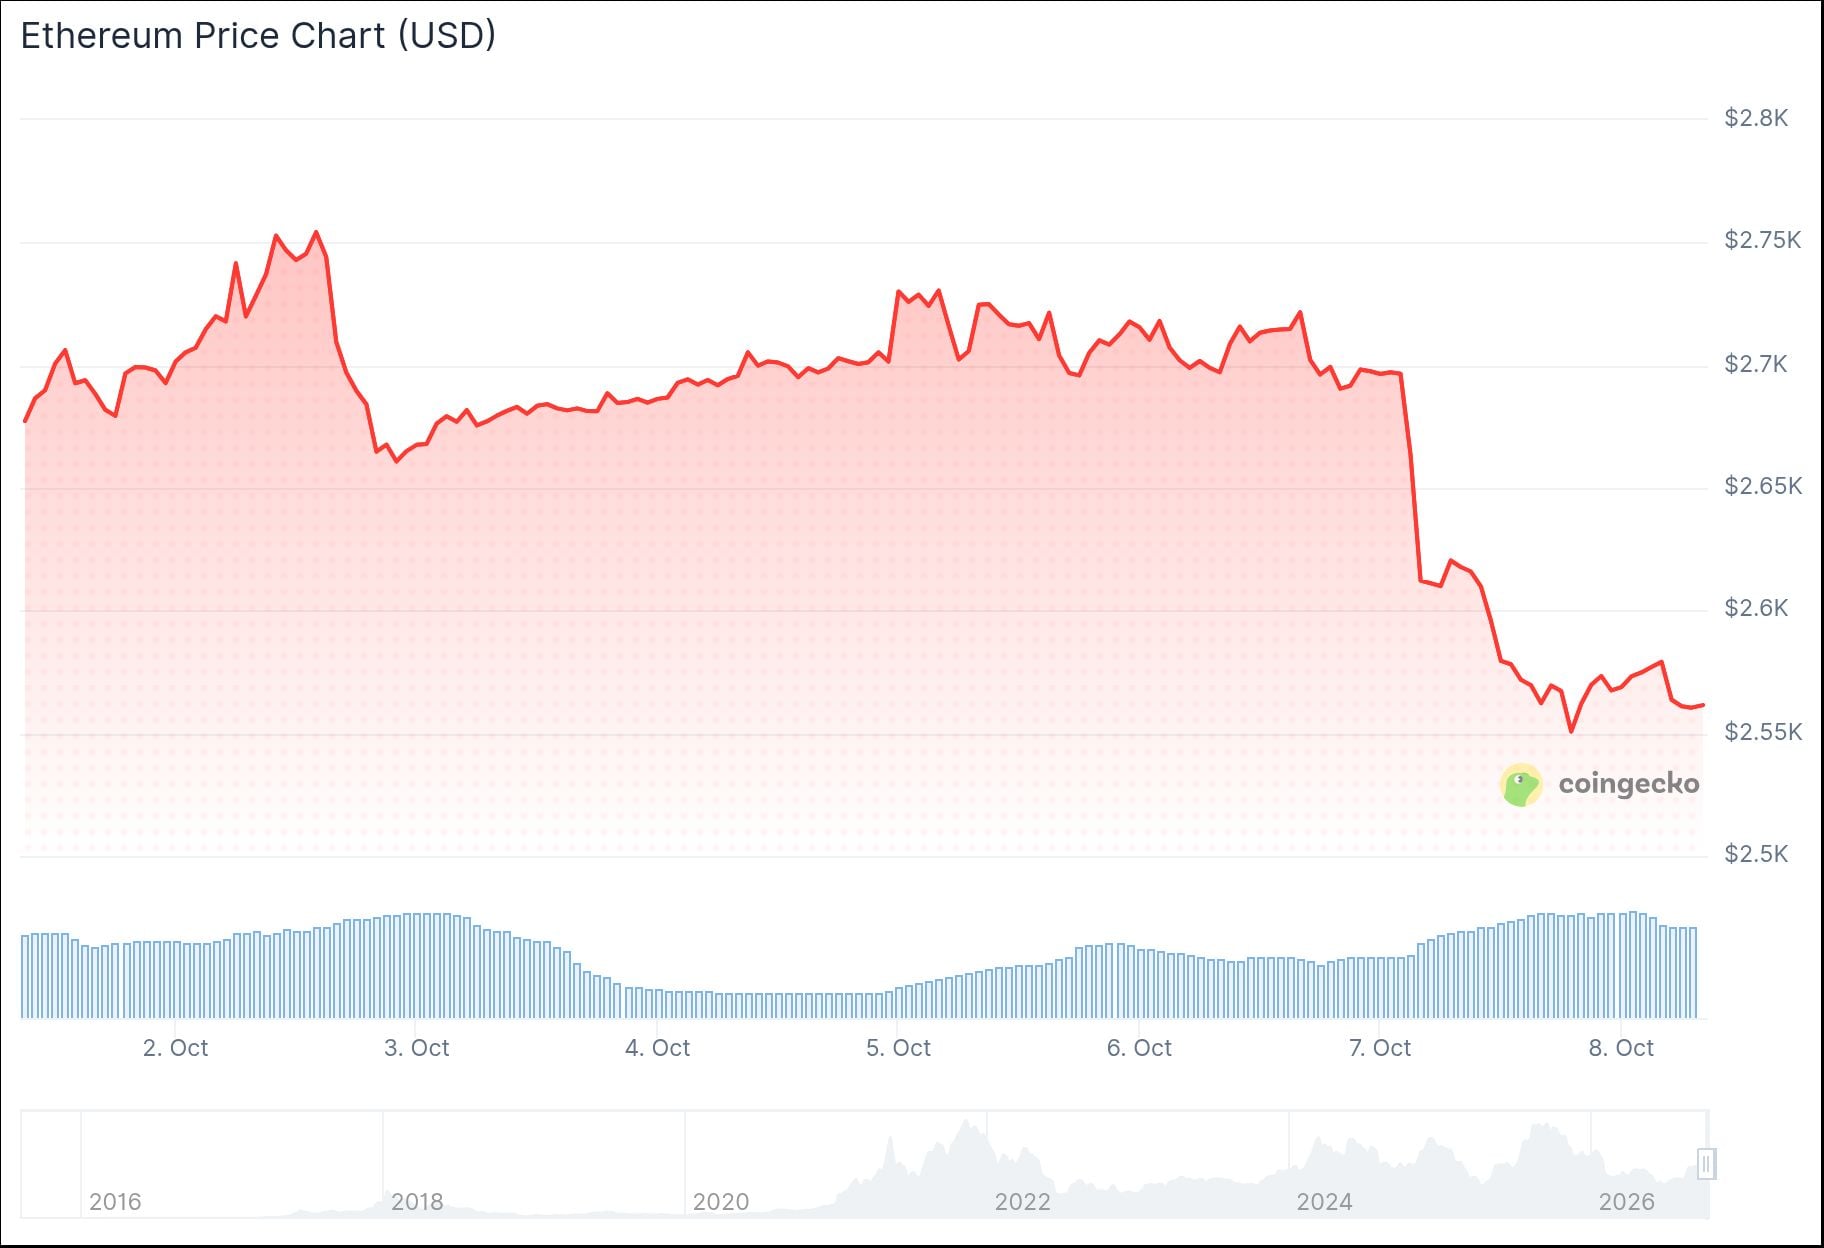
The decline came alongside a wave of forced selling. Data from CoinGlass shows $201 million in long liquidations hit the Ethereum market on October 7. That is the highest single-day figure since June 5.
Across the wider crypto market, liquidations totaled $665 million. The largest single order was an ETH/USDC position worth $26 million on Binance.
Watcher.Guru posted on X during the sell-off, writing that ETH fell under $2,600 as $400 million in crypto longs were liquidated in just 20 minutes. The post captured how fast the move happened once support gave way.
JUST IN: $ETH falls under $2,600 as $400 million in crypto longs are liquidated in the past 20 minutes. pic.twitter.com/EV73C099gN
— Watcher.Guru (@WatcherGuru) October 7, 2026
Bitcoin (BTC) also dropped sharply, falling from around $86,600 to a low near $83,060. Part of the decline followed reports of attacks on oil tankers near the Strait of Hormuz, a key global shipping route for energy supplies.
That news pushed Brent crude toward $101.50 a barrel and sent the U.S. 10-year Treasury yield to around 5.31%. Higher yields and oil prices tend to pull money away from riskier assets like crypto.

Analysts Flag the 100-Week EMA as the Key Level
Ted Pillows, an analyst on X, said Ethereum is now testing support at its 100-week exponential moving average. He warned that “a weekly close below the 100W EMA could result in a deeper correction.”
$ETH tapped the $2,600 level today.
Ethereum is now approaching its 100W EMA level, which will be a decisive one.
A weekly close below the 100W EMA could result in a deeper correction. pic.twitter.com/kHIlc3Ewtl
— Ted (@TedPillows) October 7, 2026
Past history backs up that warning. In February 2025, a close below this EMA sent ETH from $2,800 down to $1,500. A similar break in January 2026 saw ETH fall from $3,200 to $1,700.
Another analyst, Daan Crypto, said ETH has broken below its recent two-to-three week trading range. He added that rising open interest alongside falling prices suggests the downtrend could continue.
$ETH New local lows, open interest keeps rising, barely any liquidations on this last wick.
Don't think this is done yet. Seems to be heavy spot selling involved as well. https://t.co/CuPI4fvHY3 pic.twitter.com/YUEhktycfc
— Daan Crypto Trades (@DaanCrypto) October 7, 2026
Crypto trader Merlijn The Trader pointed to a different level. He wrote on X that holding the $2,500 to $2,560 zone keeps the path toward $3,000 open, saying “hold $2,500–$2,560 and $3,000 is next.”
ETF Outflows Add to the Pressure
The price drop lined up with heavy outflows from Ethereum ETFs. SoSoValue data shows $201 million left these funds on October 6, the largest single-day outflow since mid-September.
Weekly outflows reached $252 million, the highest since June 2026. Bitcoin ETFs moved the opposite way, pulling in $118 million in inflows on October 6.
Ethereum’s weighted funding rate also turned negative, falling to -0.0043%. That is the lowest reading since early September, showing traders are leaning bearish.
On the daily chart, ETH sits below its 20-day moving average of $2,684. The relative strength index has dropped to 44.55, down from 61 just days earlier.
If ETH closes below the 100-week EMA, the next support sits near $2,400, with a deeper level at $2,100. A recovery above $2,680 would be the first sign buyers are stepping back in.


