






TLDR
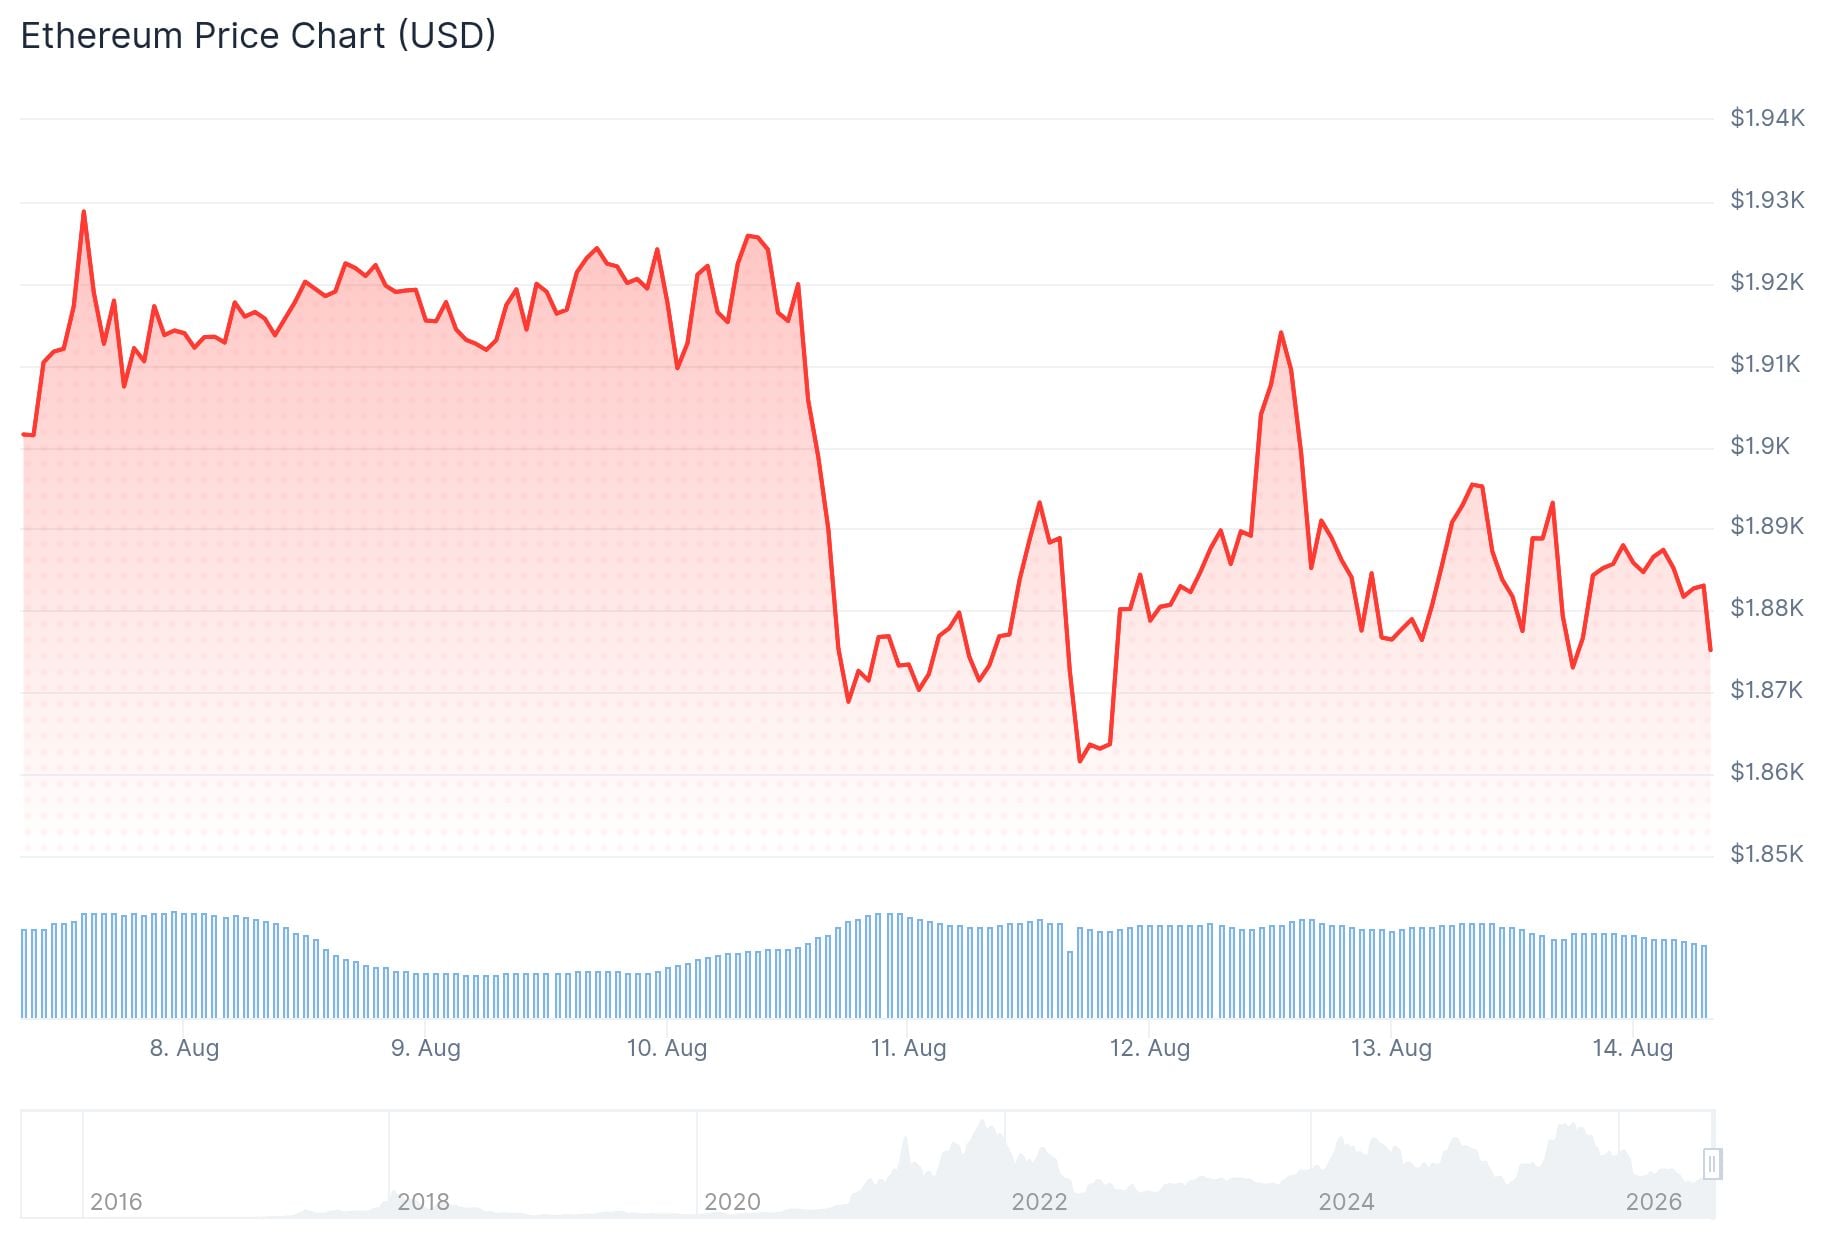
- Ethereum dropped 2.4% to $1,872 after post-CPI gains reversed below the $1,900 level
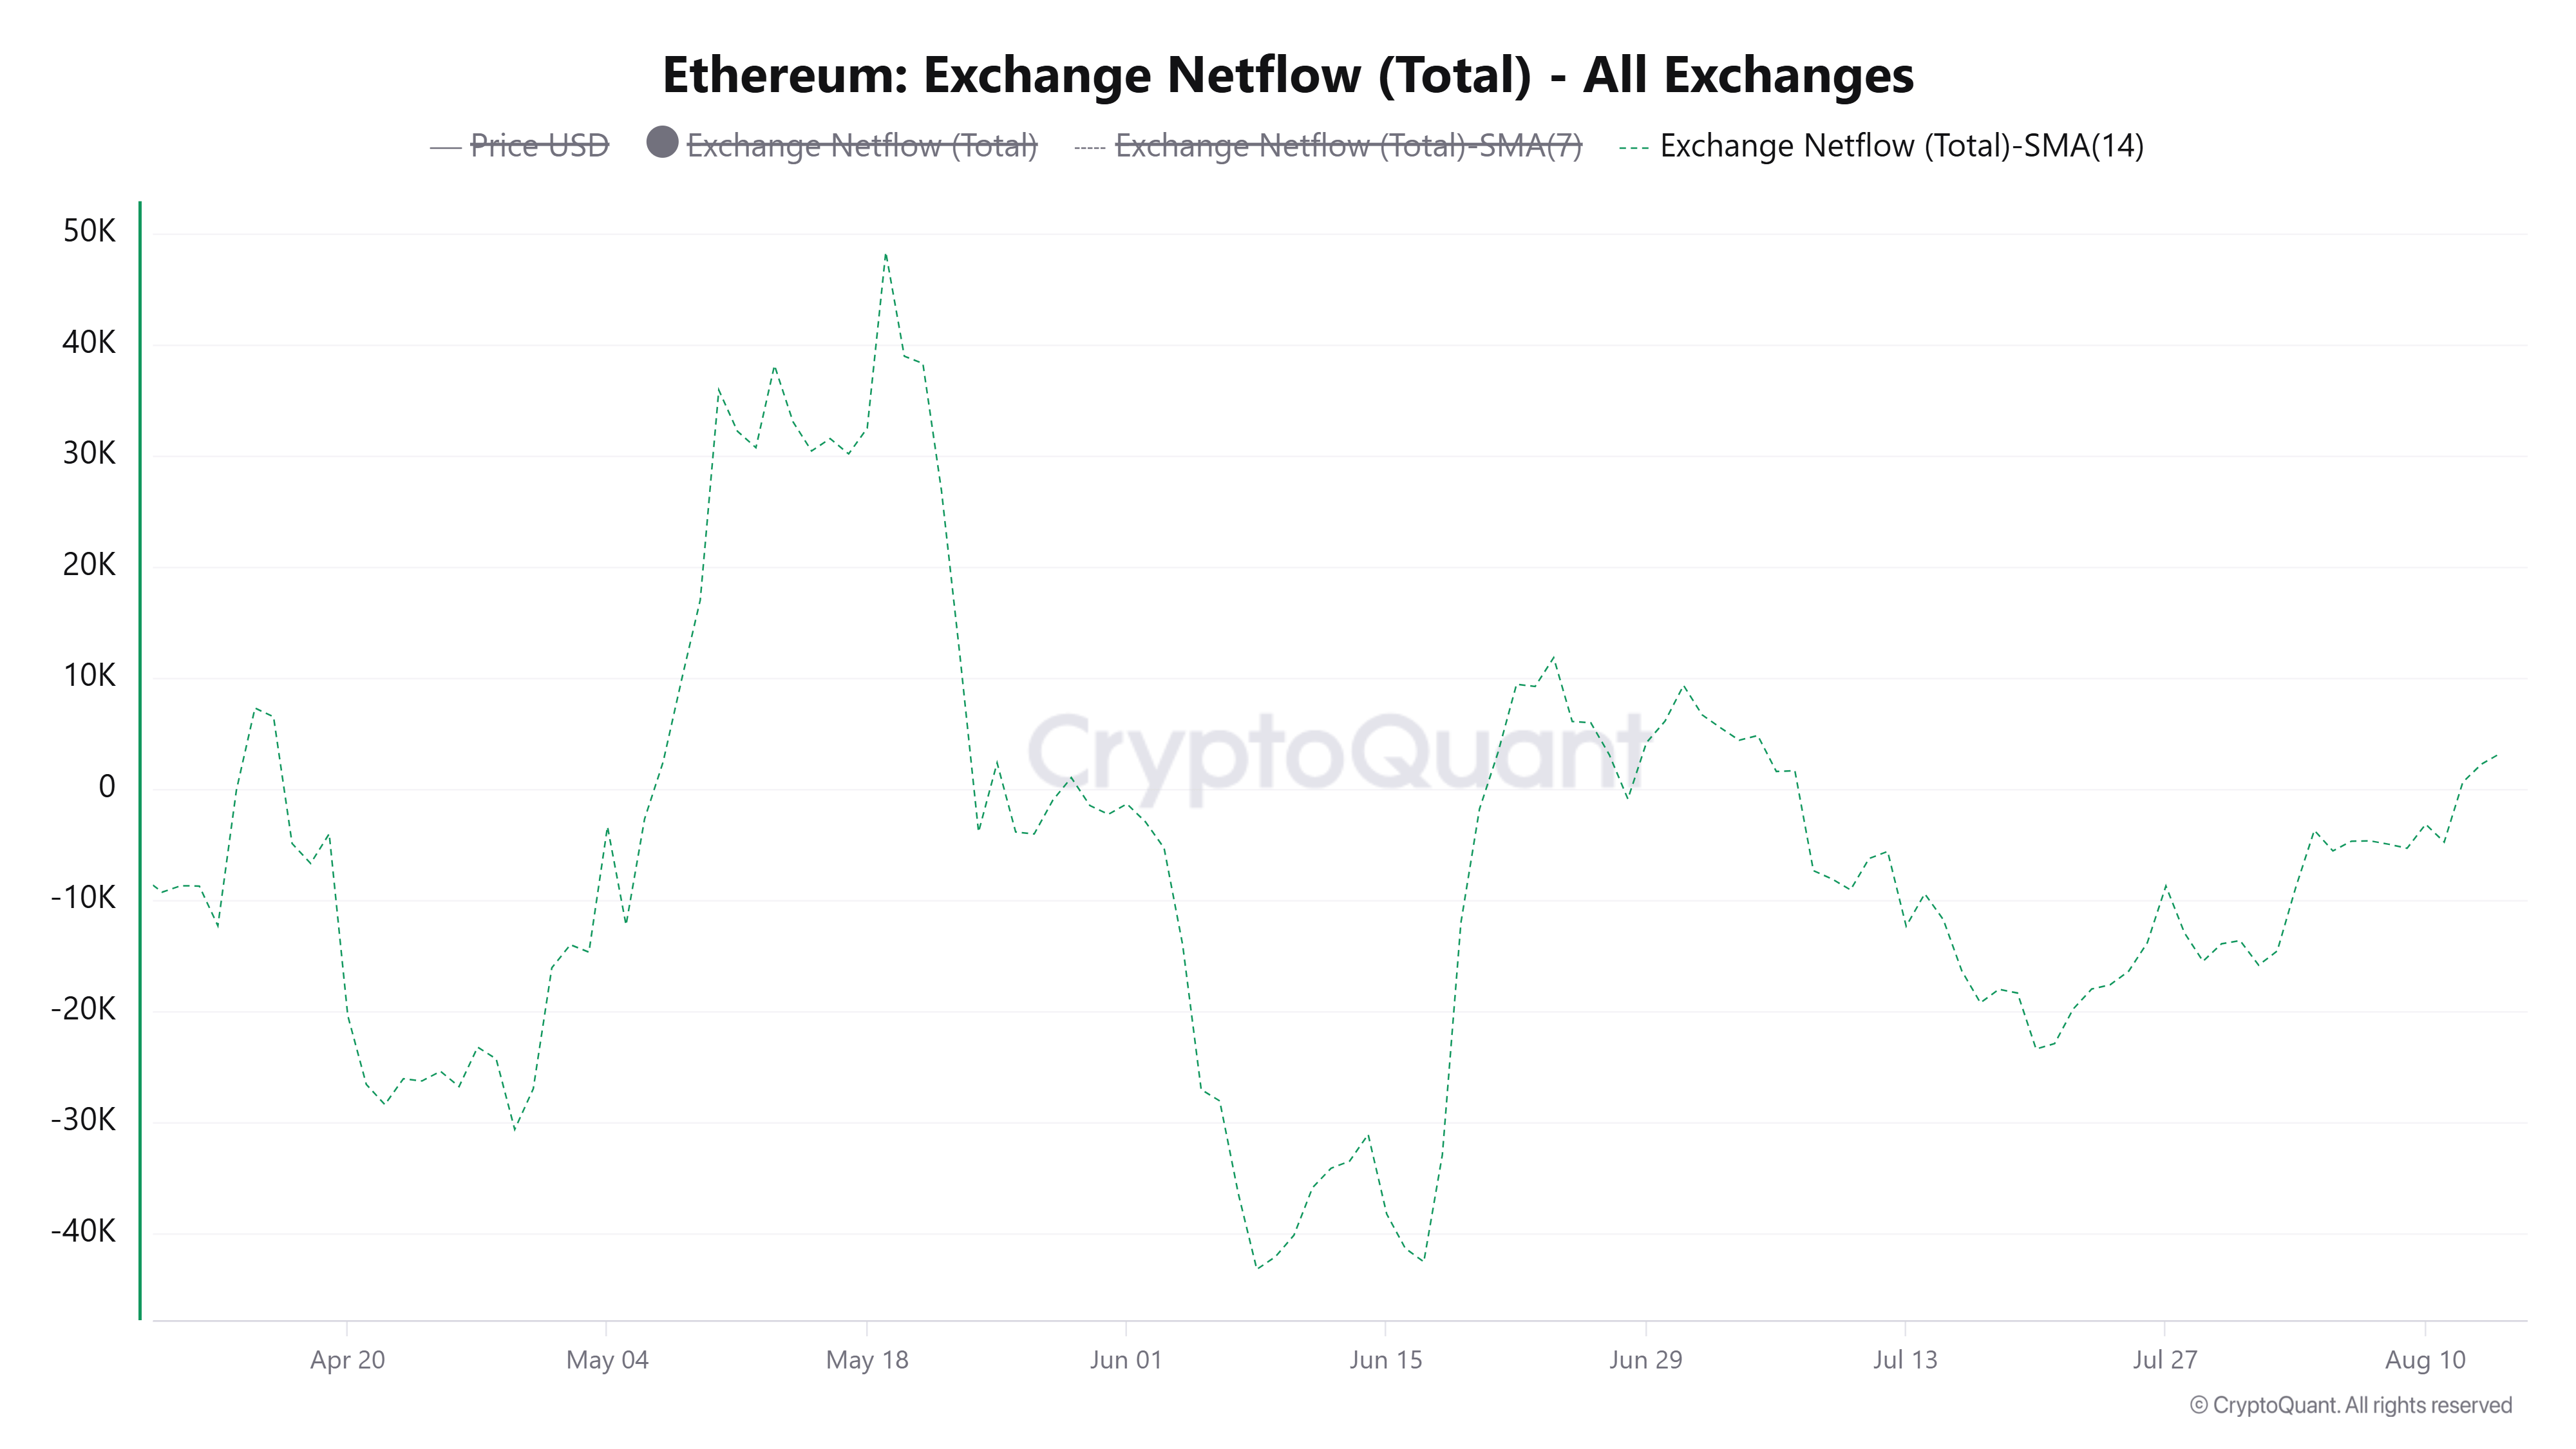
- Exchange reserves rose slightly to 15.13 million ETH, a sign of mild selling pressure
- Retail wallets sold 160K ETH while whales accumulated around 100K ETH last week
- US spot ETH ETFs saw $244.9 million in net inflows last week but modest outflows this week
- Key support sits at $1,875, with resistance clustered between $1,920 and $1,955
Ethereum fell 2.4% on August 13, dropping from an intraday high of $1,918 to a low of $1,872. The move came after traders sold into the US Consumer Price Index (CPI) release, erasing ETH’s earlier gains.
The July CPI report showed headline inflation up 0.1% month over month and 3.4% year over year. Core inflation rose 0.2% monthly and 2.5% annually. All four readings matched expectations, giving traders no fresh reason to push prices higher.
ETH had climbed ahead of the report, reaching around $1,918 before profit-taking kicked in. Once price slipped through the $1,887 level, thin liquidity allowed a quick drop toward $1,872.
Bitcoin stayed near $64,000 after the data, showing the CPI result did little to shift demand across major crypto assets.
On-Chain Signals Point to Caution
On-chain data showed weak conditions heading into the drop. ETH Exchange Netflow’s 14-day moving average flipped positive, indicating mild selling dominance. Exchange reserves edged up slightly to 15.13 million ETH, which has historically aligned with increased selling pressure.
The Coinbase Premium Index fell further to -0.081, even as US stock markets improved. This suggests US crypto-native investors remain cautious.
Retail wallets holding between 100 and 10,000 ETH offloaded a combined 160K ETH over the past week. Whale wallets, those holding 10K to 100K ETH, moved in the opposite direction, accumulating roughly 100K ETH in the same period.

US spot ETH ETFs recorded $244.9 million in net inflows last week. So far this week, they have seen modest outflows of $8.9 million.
Crypto analyst CryptoGoos noted on X that while ETH made a new low, selling pressure from long-term holders has decreased and accumulation has increased, forming a higher low. CryptoGoos described this as a bullish divergence.
$ETH has made a new low,
while selling pressure from long-term holders has decreased and accumulation has increased, forming a higher low.
This creates a bullish divergence, I like it. pic.twitter.com/2UynZpGVf7
— CryptoGoos (@cryptogoos) August 13, 2026
Key Price Levels to Watch
The daily chart shows Ethereum sitting around the $1,875 Murrey Math support level. Daily Chaikin Money Flow stood at -0.04, slightly favoring sellers. The 4-hour RSI sat at 45.15, below the neutral 50 mark, showing weak momentum.
CoinGlass liquidation data shows a major cluster between $1,945 and $1,955 above current price. Downside clusters sit near $1,850 and $1,835.
Trader Ted Pillows said ETH needs to reclaim $1,920 before any move toward $2,000 becomes possible. Analyst Daan Crypto Trades focused on the ETH/BTC pair, identifying 0.03 BTC as the key level needed to confirm relative strength against Bitcoin.
$ETH I am still favouring for this to move higher as long as it holds on to this current support.
Would have expected a quicker acceleration by now but it just takes one candle to get things going. 0.03 is the level to break for continuation. pic.twitter.com/jxCk7PzCEi
— Daan Crypto Trades (@DaanCrypto) August 12, 2026
CryptoQuant analyst MorenoDV noted that ETH’s Net Unrealized Profit/Loss on Binance is approaching the -0.35 level, a reading that historically aligned with major bottoms in late 2019, March 2020, and the 2022 lows.
ETH was trading near $1,879 at the time of writing, holding above the 20-day EMA at $1,884 and the 50-day EMA at $1,865.


