


 Price: What the $1,700 Level Means for ETH Right Now")


TLDR
- ETH is trading around $1,670, up just over 1% in 24 hours, with bearish structure still intact
- A bear flag pattern keeps ETH under pressure unless it breaks above $1,700
- A break above $1,700 could open the path to $1,850–$1,900; failure risks a return to $1,500
- Nearly 500,000 ETH worth ~$800 million were withdrawn from exchanges last week, a possible accumulation signal
- Ethereum ETFs posted $16 million in outflows Thursday, extending a three-day losing streak
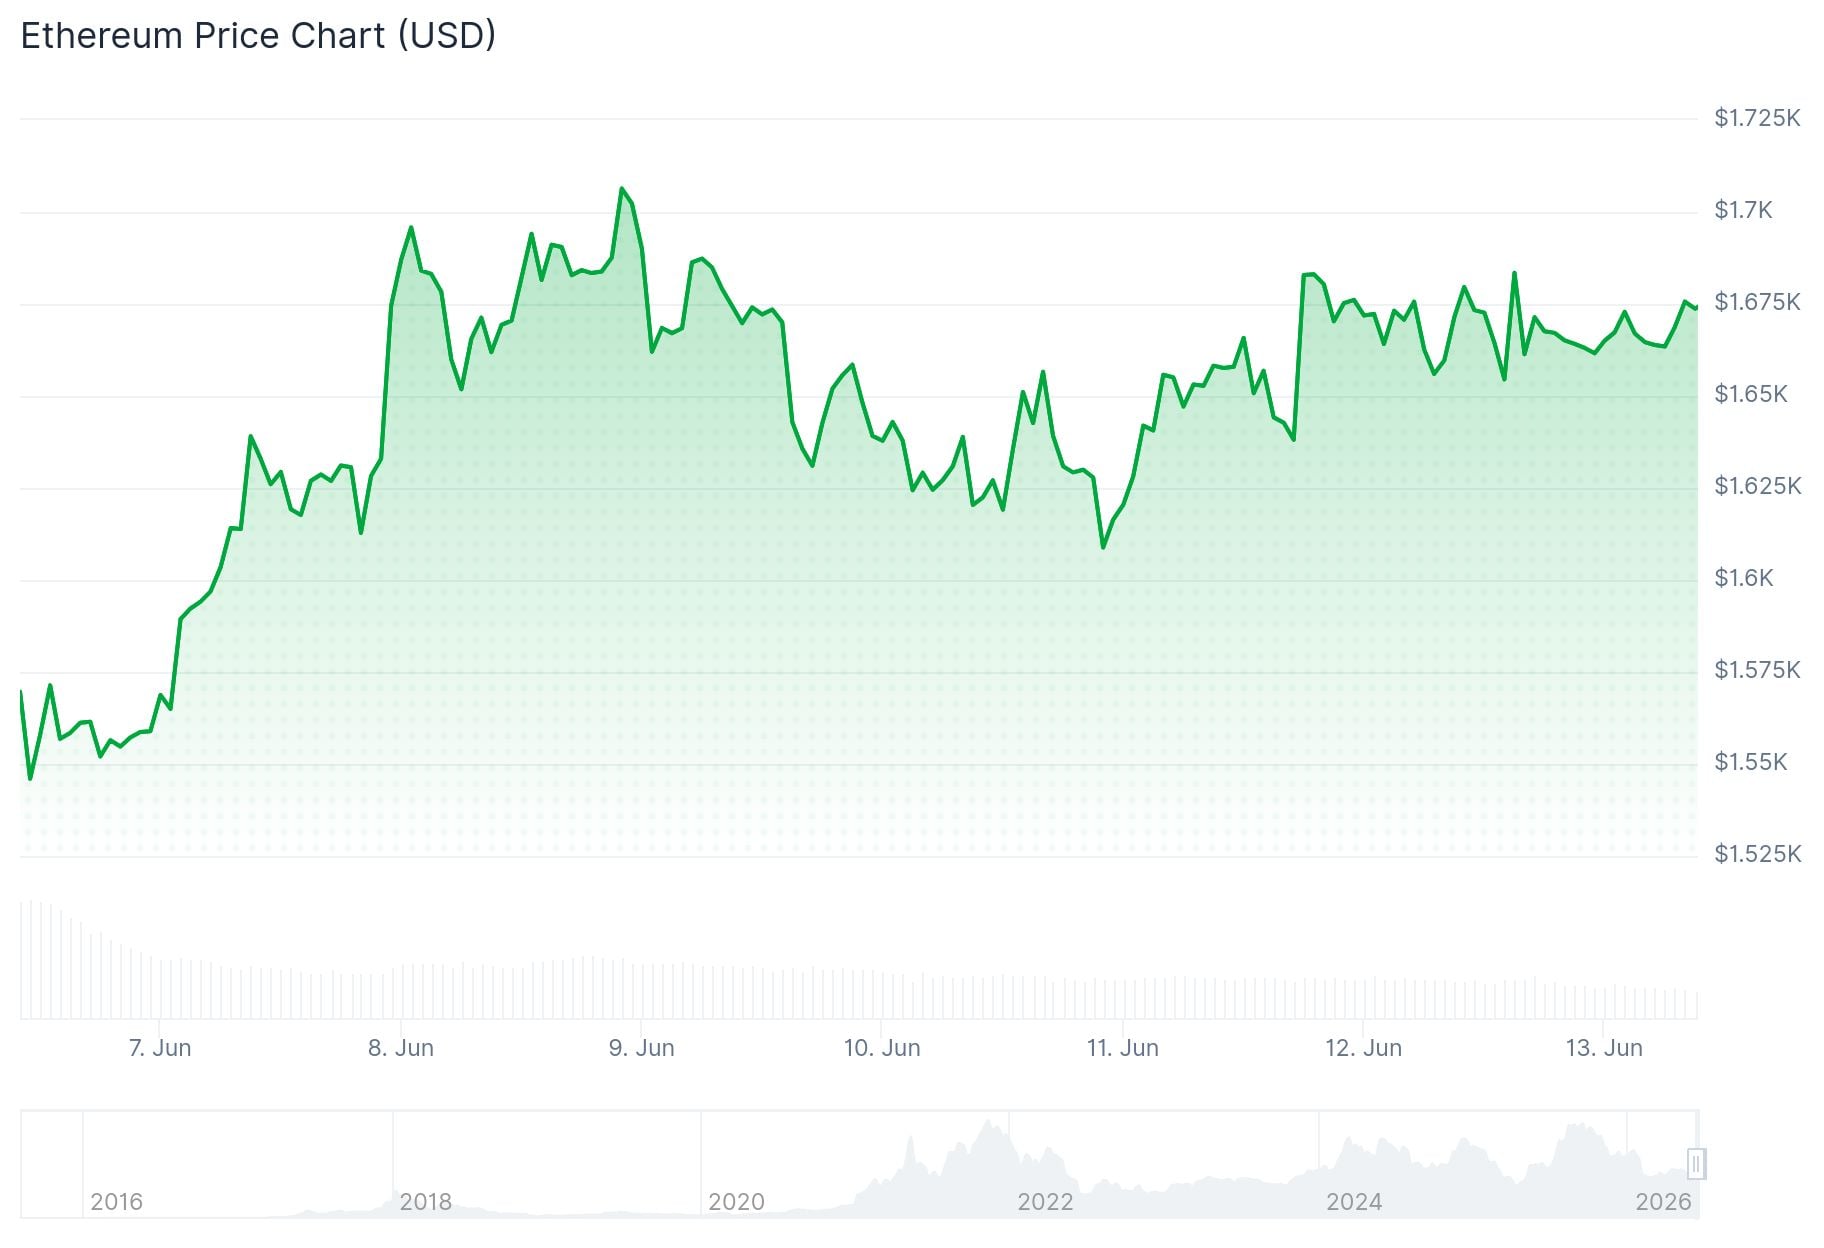
Ethereum has been showing small signs of stability after a sharp sell-off, but the overall price structure remains bearish. ETH was trading around $1,670 at the time of writing, with a 24-hour gain of just over 1%.
That modest rise comes after a major drawdown from mid-May, driven largely by geopolitical tensions and macroeconomic uncertainty. The recovery looks fragile rather than sustainable at this stage.
Crypto analyst Ted pointed out that ETH is still trading inside a bear flag formation. This pattern typically signals continued downside unless the price breaks free.
$ETH is still trading within this bear flag.
A breakout above the $1,700 level is needed for a move towards $1,850-$1,900.
Otherwise, the chances of Ethereum sweeping lows around $1,500 will go up. pic.twitter.com/8UpAbRYzFi
— Ted (@TedPillows) June 12, 2026
For ETH to shift the outlook, it needs to close above the $1,700 resistance level. A confirmed break there could push the price toward $1,850–$1,900.
If that resistance holds, the risk of another leg lower returns. In that case, the $1,500 support level would come back into focus.
Exchange Withdrawals Hint at Possible Accumulation
Analyst Ali Charts noted on X that nearly 500,000 ETH — worth roughly $800 million — were pulled from trading platforms over the past week. Large withdrawals from exchanges can indicate that holders are moving coins into cold storage, which some read as an early accumulation signal.

Nearly 500,000 Ethereum $ETH, worth roughly $800 million, have been withdrawn from trading platforms over the past week.
This could be an early sign of accumulation. https://t.co/LNkygeYlUV pic.twitter.com/afPADae2pP
— Ali Charts (@alicharts) June 13, 2026
On-chain data adds more context to the picture. The number of active Ethereum addresses dropped to around 480,000 on Thursday, down from 554,000 earlier and well below the 738,000 seen in late April.
Falling active addresses while price attempts a recovery suggests the rebound lacks broad participation. That kind of divergence often precedes a correction.
ETF Outflows Add Pressure
Ethereum ETFs have seen three straight days of outflows. Thursday’s total was $16 million, following $41 million on Tuesday and $36 million on Wednesday.
Derivatives markets are also reflecting caution. Open interest in Ethereum futures dropped to $22.98 billion on Friday, down from $30.95 billion at the start of June.
The MACD line sits at around -138.24, below the signal line at -130.37, confirming bears remain in control. The RSI hovers just above 30, suggesting the asset is near oversold territory but hasn’t confirmed a reversal.
ETH is trading well below its 50-day, 100-day, and 200-day EMAs at $2,000, $2,148, and $2,405. Those levels represent significant overhead resistance.
The most recent data puts ETH at $1,688, still capped below $1,700 with no confirmed buy signal on the daily chart.


