






TLDR
- Ethereum (ETH) trades near $2,213 on Friday, down 1.2% on the day.
- US spot Ethereum ETFs lost $99.9 million on November 5, ending a one-day inflow.
- Amundi launched a tokenized share class of a €22.8 billion fund on Ethereum.
- The network handled about 2.19 million transactions in 24 hours.
- Support sits at $2,200 to $2,210, while resistance holds at $2,400 to $2,450.
Ethereum (ETH) is trading near $2,213 on Friday, November 6. That is a drop of 1.2% as the coin tries to recover from its recent correction.
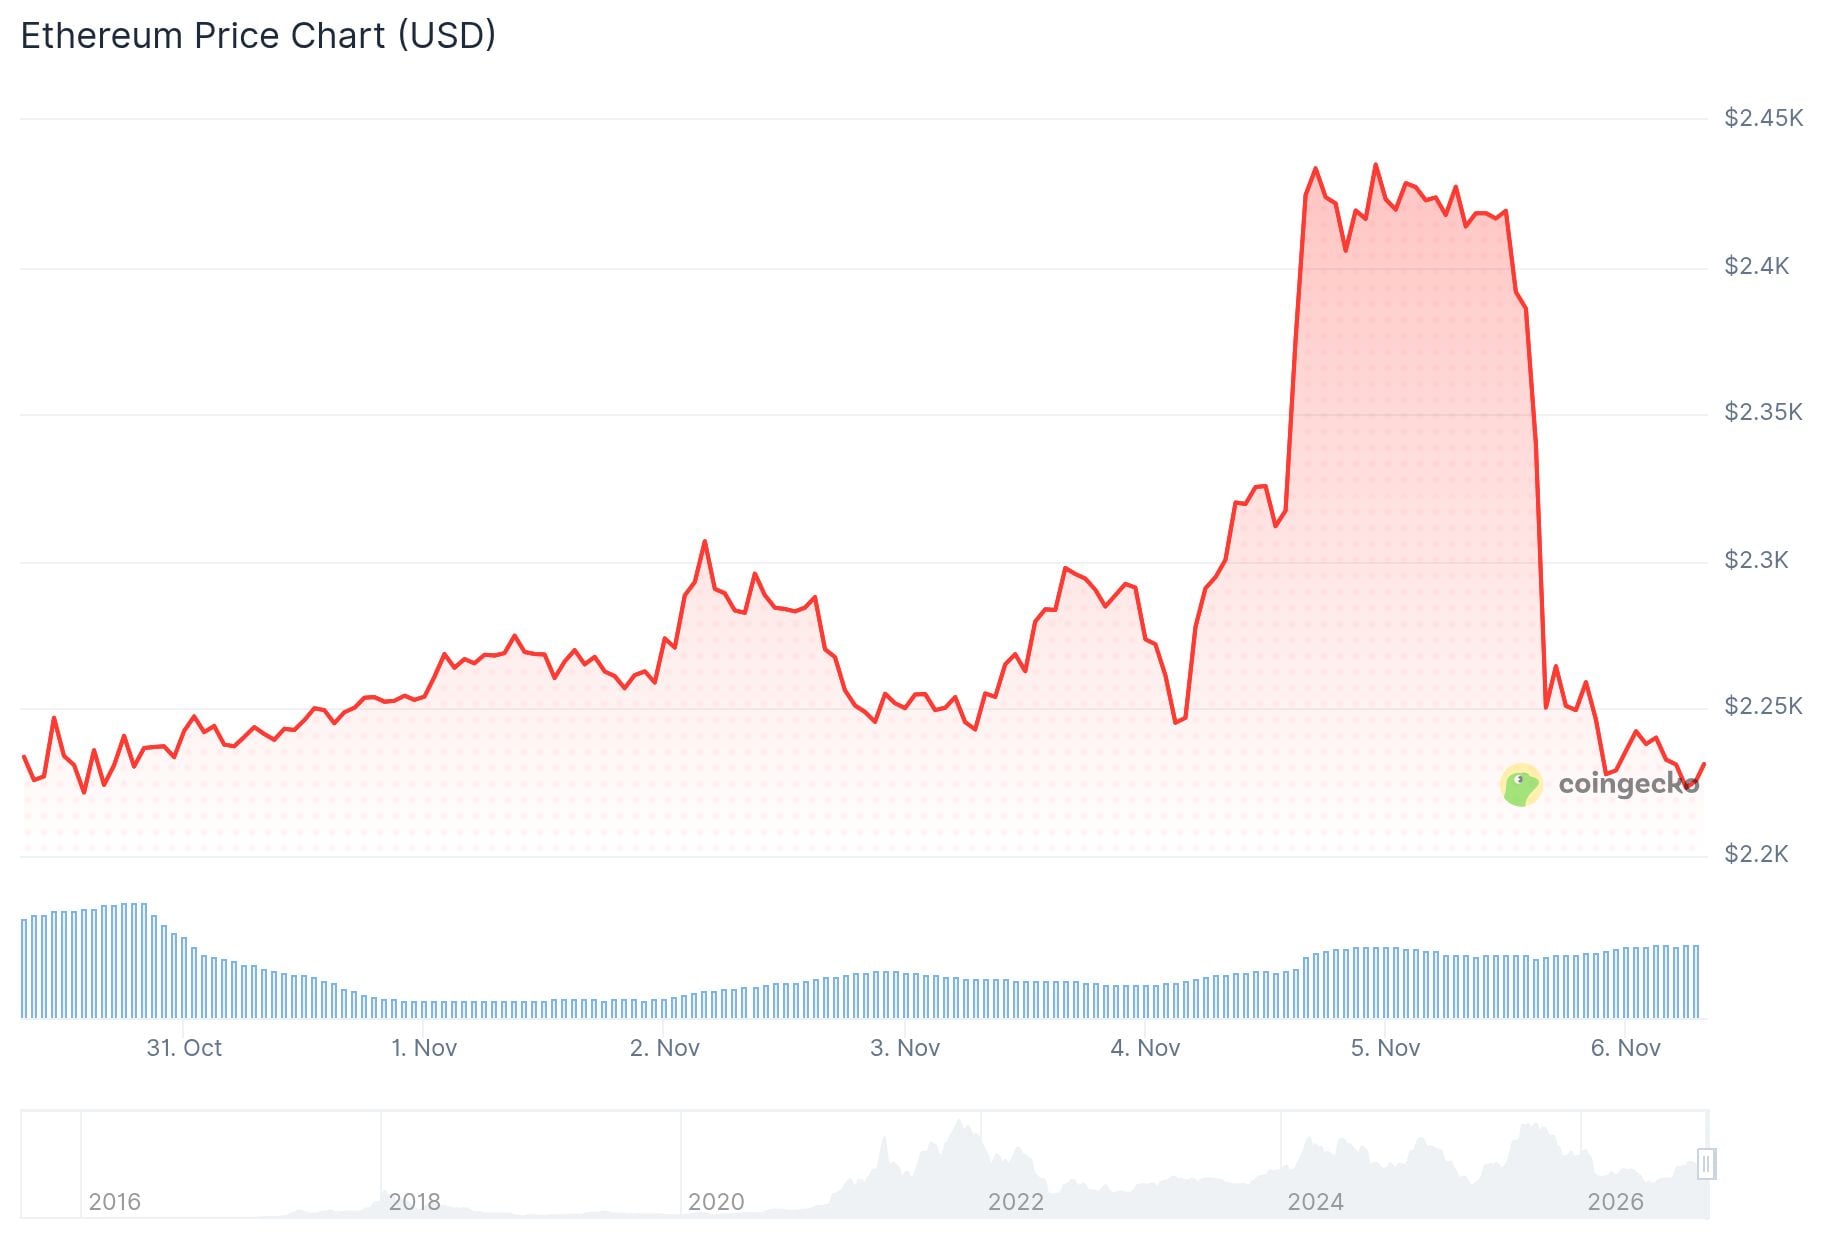
ETH has slipped below an ascending trendline. Its latest try at the $2,400 resistance zone ended with more selling.
Analyst Ash Crypto posted on X that if Ethereum’s historical pattern repeats, the next move could be a large one. He did not give a price target or a timeframe.
If ETH’s historical pattern plays out again, the next move could be massive. 🚀 pic.twitter.com/6HmWpZ6SQT
— Ash Crypto (@AshCrypto) November 5, 2026
On November 5, European asset manager Amundi launched a tokenized share class of its Core STOXX Europe 600 index fund on Ethereum. The product was built with CACEIS.
Fund shares can now be represented on the blockchain, while the traditional ways of buying them stay in place. The underlying fund holds about €22.8 billion, but that is not the amount that was tokenized.
Bullish, an institutional crypto platform, also named Ethereum, Solana and Aptos as its first network partners for equity tokenization. The news followed a demo that used 61 million tokenized Bullish shares at the New York Stock Exchange.

ETF Flows Turn Negative Again
US spot Ethereum ETFs recorded $99.9 million in net outflows on November 5, according to Farside Investors. The day before, the funds had taken in $53 million.
JUST IN: BlackRock ETF clients sold $75.20 million worth of $ETH. pic.twitter.com/ytS7QozllN
— Whale Insider (@WhaleInsider) November 6, 2026
BlackRock’s ETHA fund made up $75.2 million of the outflows. Its ETHB fund added another $22 million.
The November 4 inflow had briefly stopped a seven-session streak of withdrawals. From October 26 to November 5, the funds lost about $703.3 million in total.
Since launch, the funds still show cumulative net inflows of close to $12 billion.
DefiLlama data from November 6 shows Ethereum processed about 2.19 million transactions in 24 hours. The network had 686,322 active addresses in that time.
Decentralized exchange volume reached $2.66 billion over the day. Seven-day DEX volume rose 21.78%.
Total value locked in Ethereum DeFi fell 5.57% in 24 hours to about $43.3 billion. Stablecoin market capitalization dropped 3.37% over seven days to $136.55 billion.
On the daily chart, ETH was rejected from the $2,700 to $2,800 area in late September. It had found support near $1,500 in June and built an ascending trendline from there.
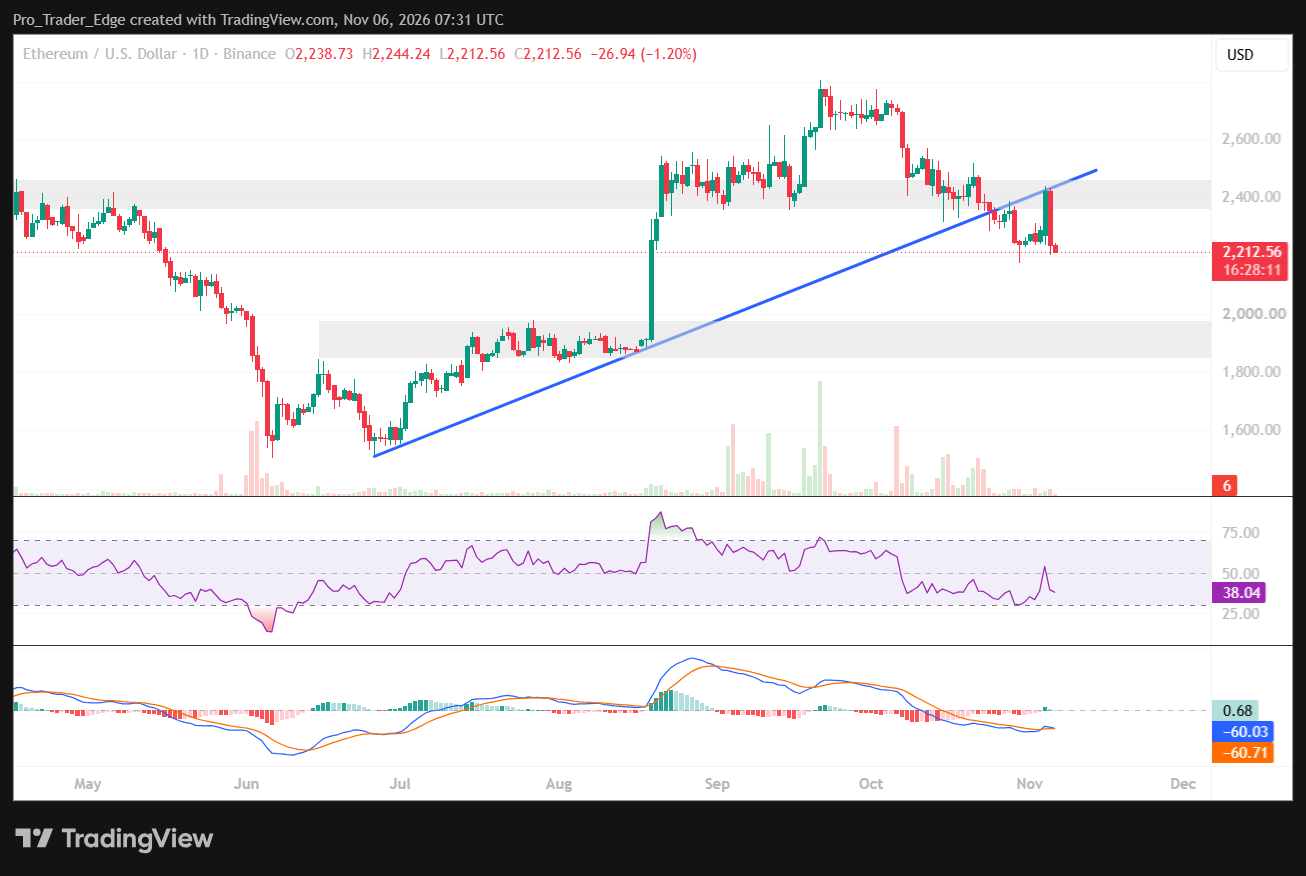
ETH broke below that trendline during the October correction. In early November, it bounced toward $2,400 to $2,450 and was turned back near the trendline and a former consolidation zone.
The nearest support is at $2,200 to $2,210, followed by $2,150. A daily close under $2,150 would put the $2,000 level in view, and below that sits a demand zone from $1,850 to $1,970.
On the upside, ETH needs to reclaim $2,300, then $2,350. The main resistance remains $2,400 to $2,450, and a move above $2,450 with strong volume could open a path toward $2,600.
The Relative Strength Index (RSI) reads 38.04, under the neutral 50 mark but above oversold levels. It briefly climbed toward 50 during the latest bounce before falling back.
The MACD line is at -60.03 and its signal line is at -60.71, both below zero. The histogram reads 0.68, a small positive reading.


