





TLDR
- SOL flashed its first 3-day SuperTrend buy signal since October 2025, suggesting a potential trend shift
- Analyst Ali Charts reported 1.6 million new Solana addresses added in the past two weeks
- Binance top traders hold a Long/Short Ratio of 1.89, with 65.45% of positions leaning long
- Key resistance at $84 must be cleared for SOL to target $90, then potentially $100
- Bullish RSI divergence on the weekly chart suggests the corrective phase may be nearing its end
Solana is showing early signs of a trend reversal after a key technical indicator flipped bullish for the first time in months. The move comes after a lengthy correction that saw SOL drop as low as $60 in June.
The SuperTrend indicator on the 3-day chart has generated a buy signal — the first since October 2025. The previous sell signal preceded a 74% price drop, so traders are watching this new signal closely.
Analyst Ali Charts flagged the signal on X, pointing to the SuperTrend flip below price as evidence that buying momentum may be building. The SuperTrend uses average true range to track trend direction, and when it moves below price, it is generally read as bullish.
SOLANA: FROM BEARISH TO BULLISH
The SuperTrend indicator has triggered a new buy signal on the Solana 3-day chart.
• First Signal Since October 10: The Average True Range (ATR) trailing stop has flipped beneath the price action, marking the first SuperTrend buy signal since… pic.twitter.com/j0FCmDm3jq
— Ali Charts (@alicharts) July 4, 2026
Ali Charts also shared a separate data point: 1.6 million new addresses have joined the Solana network over the past two weeks. That kind of network growth can reflect rising user activity and broader interest in the ecosystem.
1.60 MILLION NEW ADDRESSES!
That’s how many have joined the Solana $SOL network over the past two weeks as network growth accelerates. https://t.co/CZXB9kPtOz pic.twitter.com/KnWBDZLx72
— Ali Charts (@alicharts) July 5, 2026
Smart Money Positioning
Binance’s top traders are leaning heavily long. Data from CoinGlass shows long accounts make up 65.45% of tracked positions, with short accounts at 34.55%. That gives a Long/Short Ratio of 1.89.

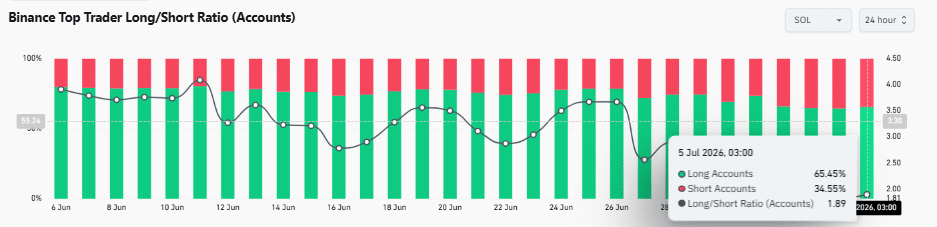
Even after SOL recovered from June’s lows, professional traders did not reduce long exposure. That suggests institutional participants still expect more upside.
The OI-Weighted Funding Rate sits at a positive 0.0027%, meaning leveraged traders are paying to hold long positions. Funding has stayed above neutral throughout the recent recovery without reaching levels that signal overheating.
Key Price Levels to Watch
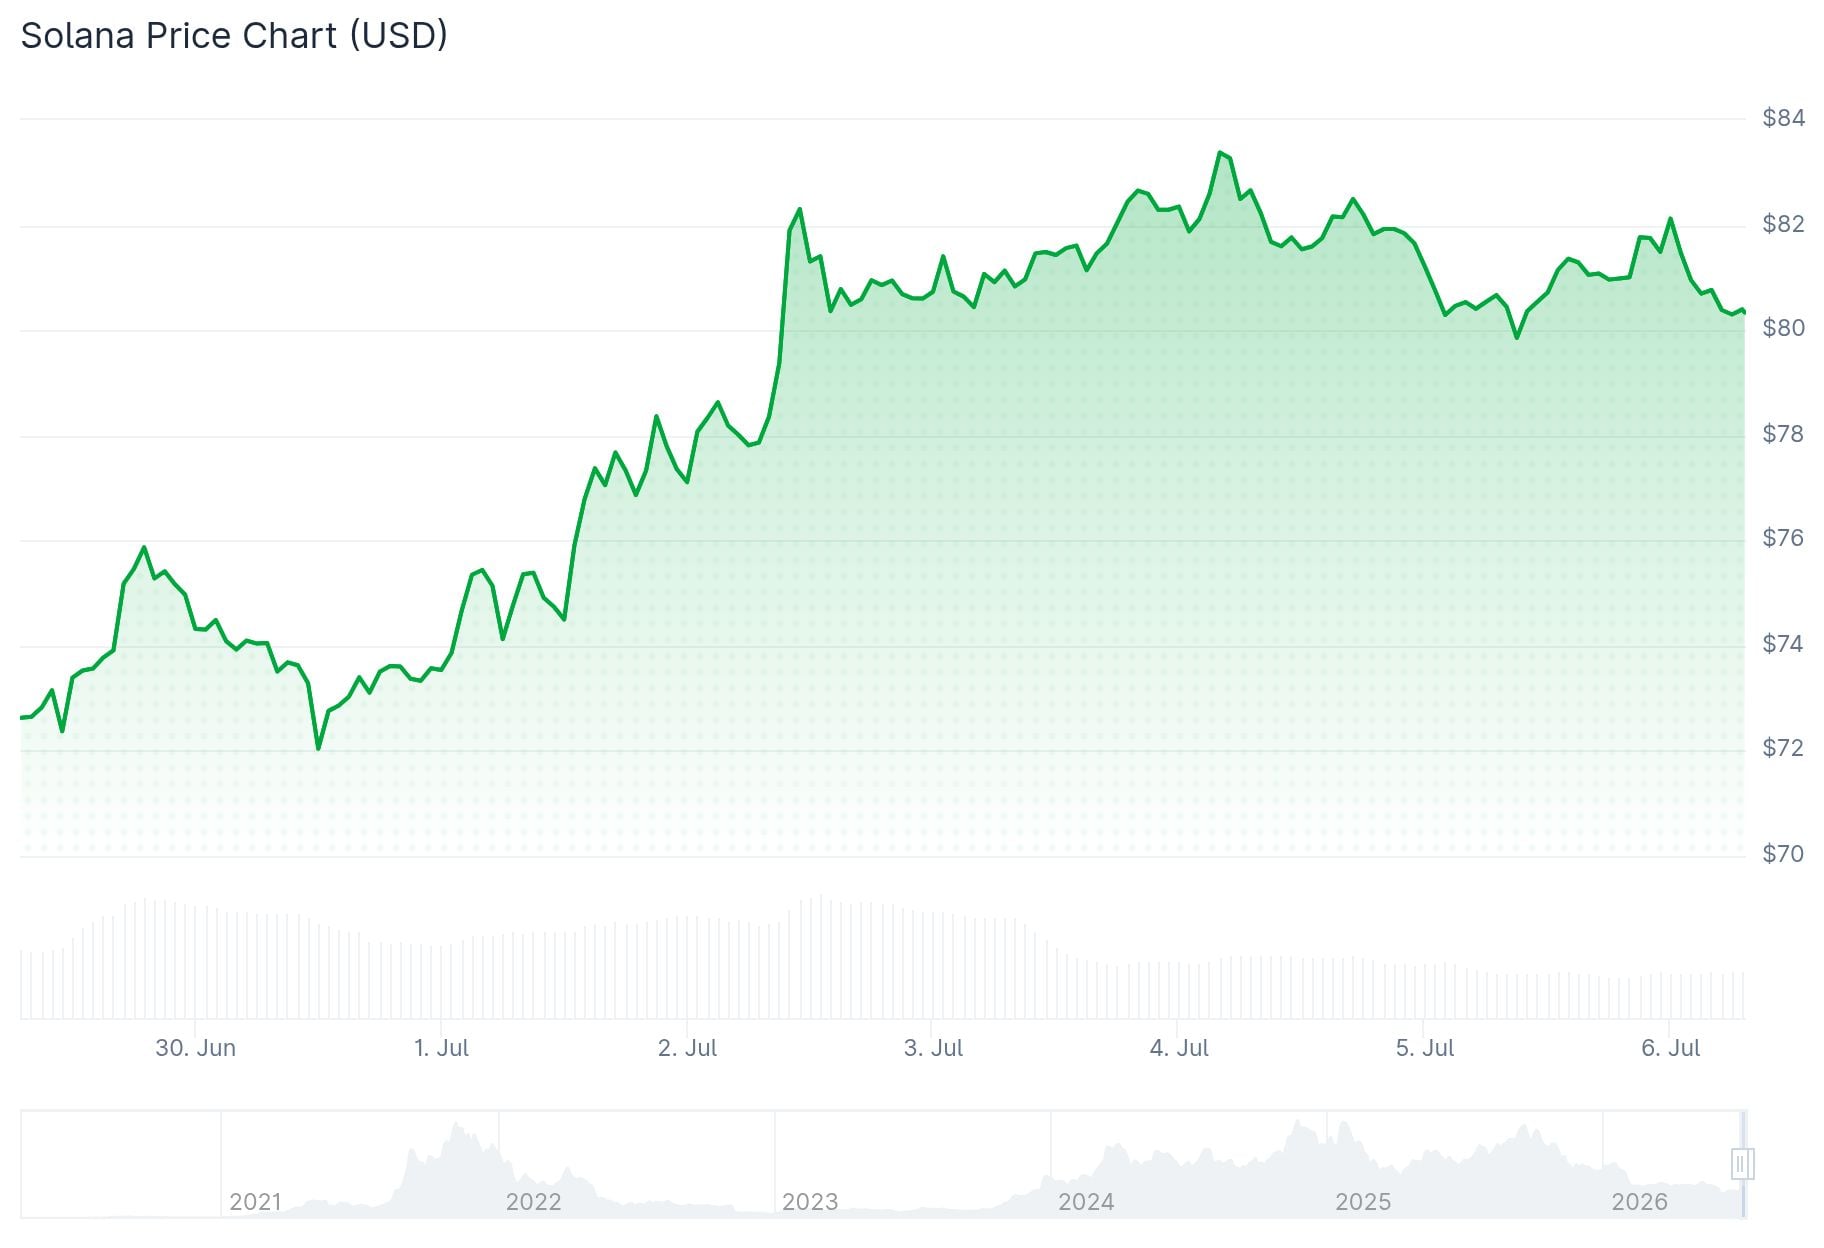
SOL is currently testing resistance near $84. Buyers have already reclaimed the $78.07 support level, keeping the short-term structure intact.
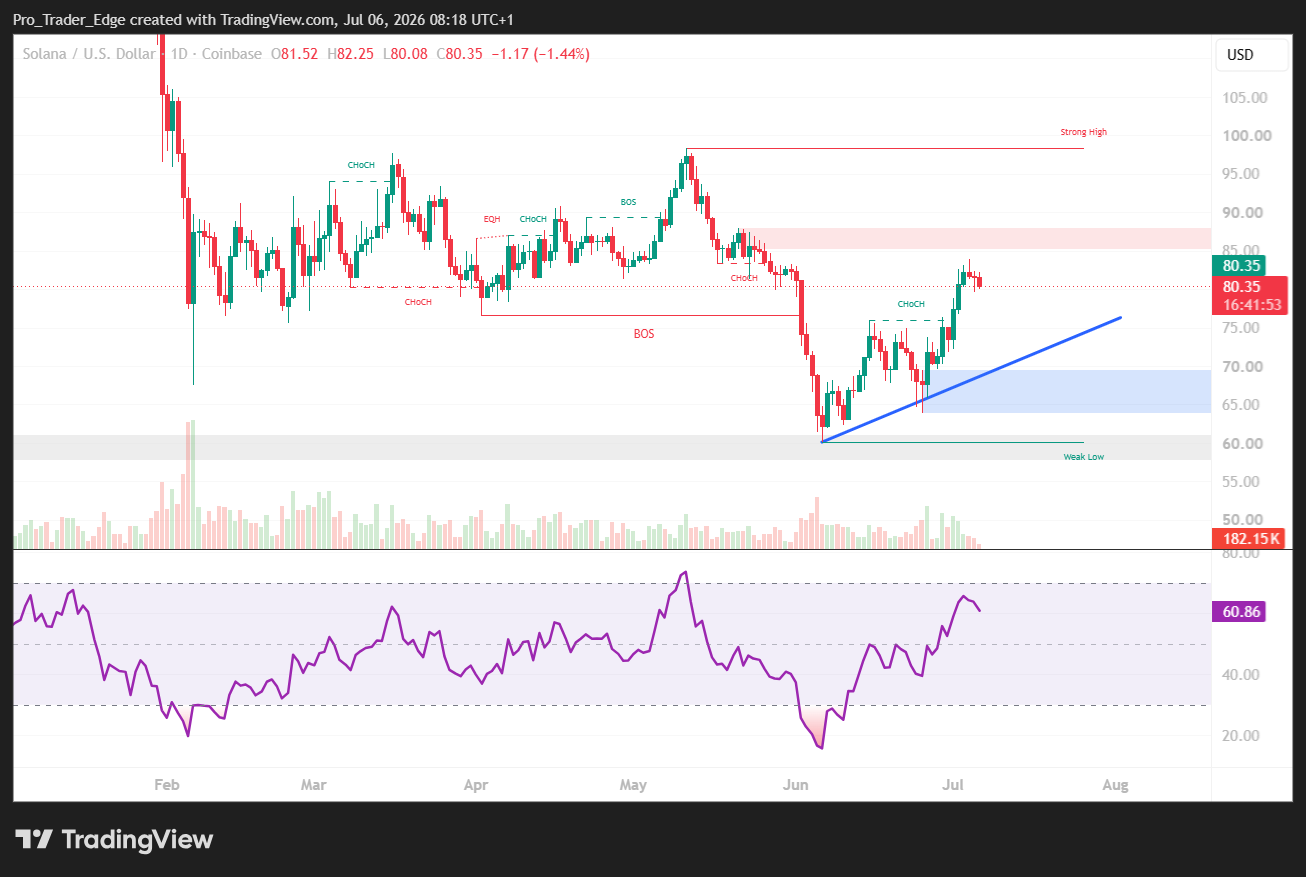
The daily RSI sits at 61.20, with its Moving Average at 52.66. Both readings show buying pressure remains above the neutral level.
A close above $84 would likely open the door toward $90. A rejection at that level could send SOL back to retest $78.07.
On the weekly chart, analyst TraderJB identified bullish RSI divergence near the end of what he calls a wave C corrective structure. He noted that the same divergence appeared in reverse at the previous top before the correction began.
TraderJB described the current zone as a strong risk-reward area for spot accumulation if the wave count holds.
SOL’s most immediate test remains the $84 resistance level, with the next targets at $90 and $100 if buyers can sustain the current structure.


