


TLDR
- XRP rose 3% to an intraday high of $1.11 on July 3, recovering from $1.02 on July 1
- A Supertrend buy signal flashed for the first time since mid-June, with the last signal preceding a 14% rally
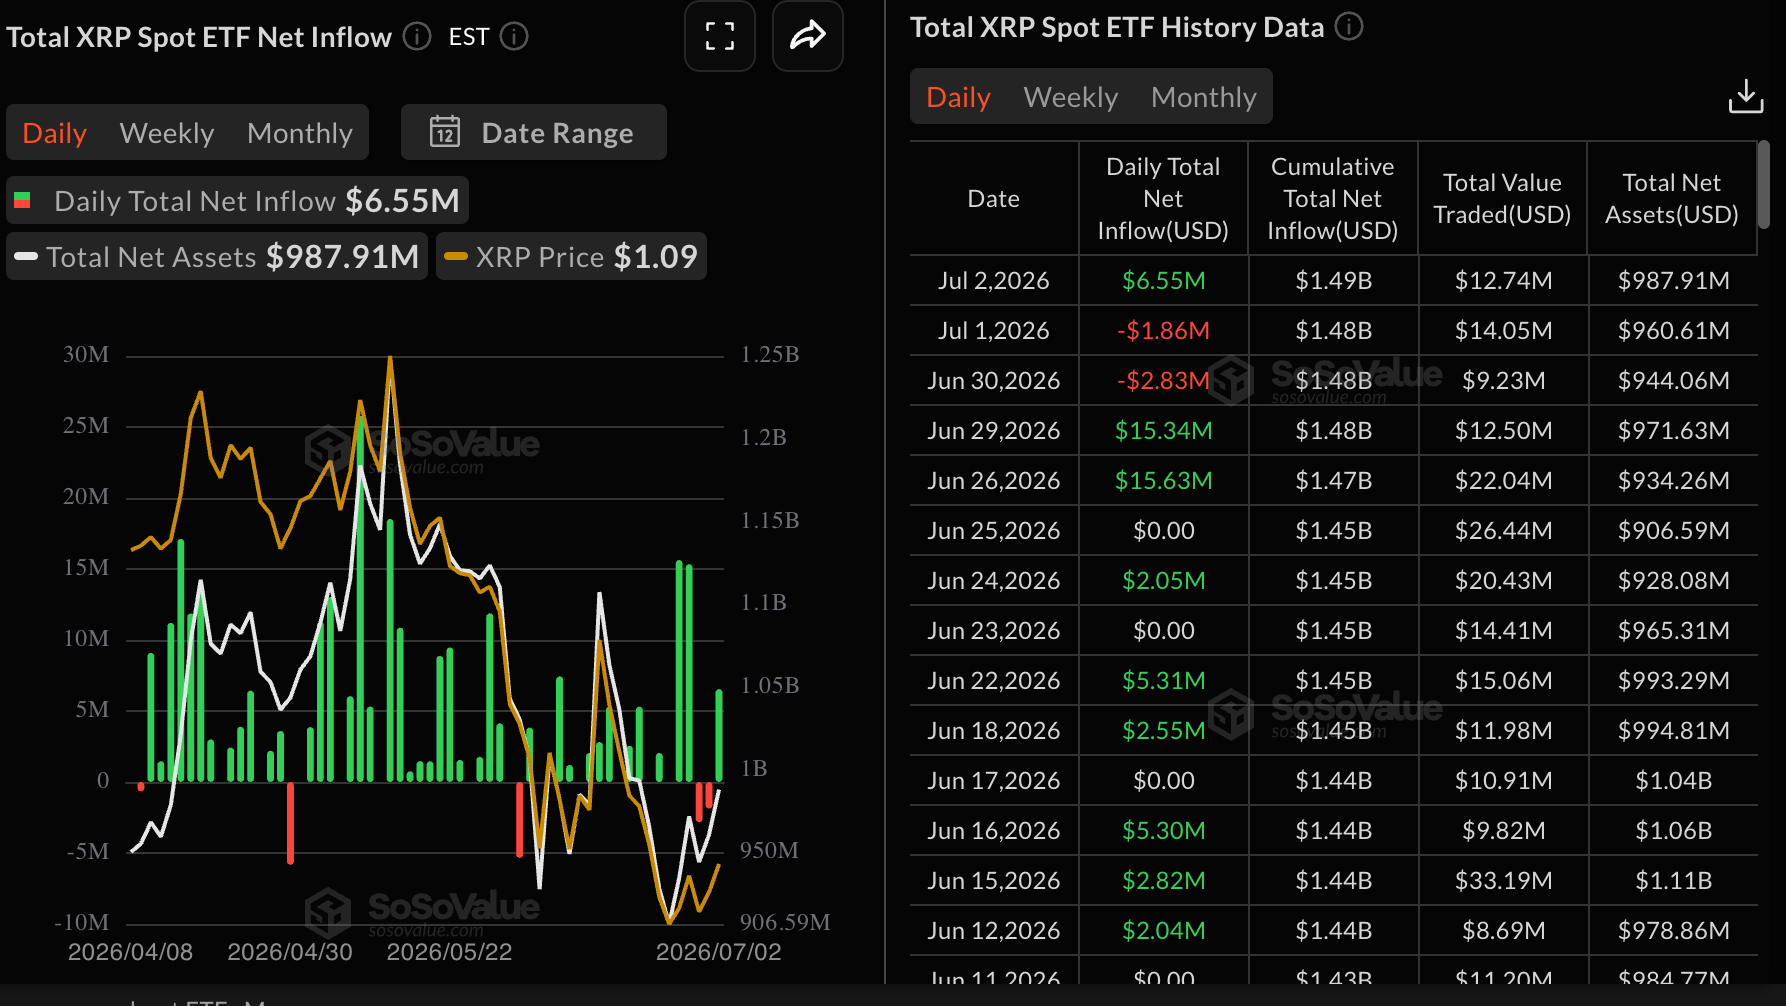
- XRP ETF inflows resumed Thursday at nearly $7 million after two days of outflows
- Ripple launched payments in Europe under MiCA’s preliminary CASP approval framework
- Key resistance sits between $1.11–$1.15, with Supertrend support near $1.05
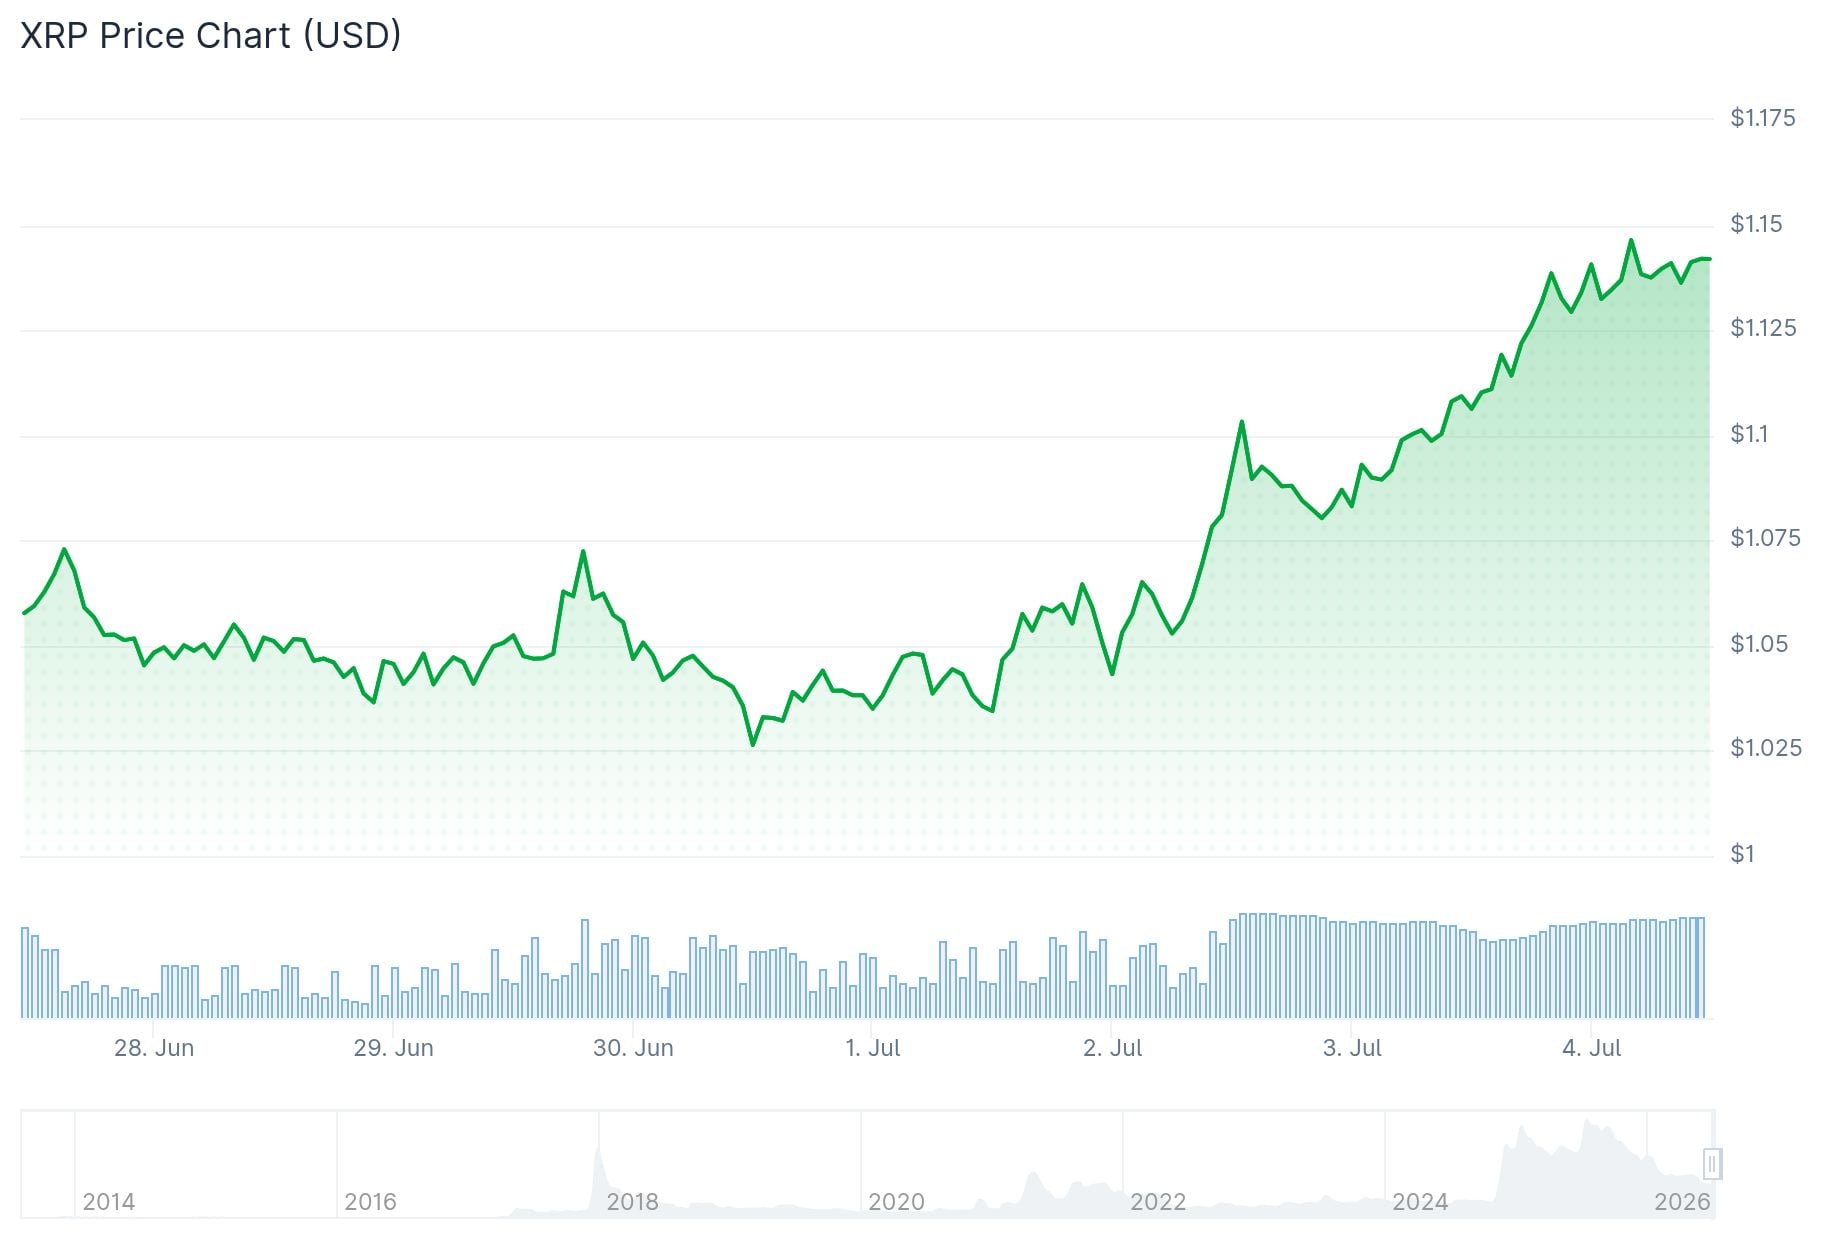
XRP has climbed back above $1.10 after a difficult start to July. The token hit an intraday high of $1.11 on July 3, up around 3% from a low of $1.02 reached just two days prior.
The recovery comes as several positive factors lined up at once — renewed ETF buying, a bullish technical signal, and fresh momentum from Ripple’s European expansion.
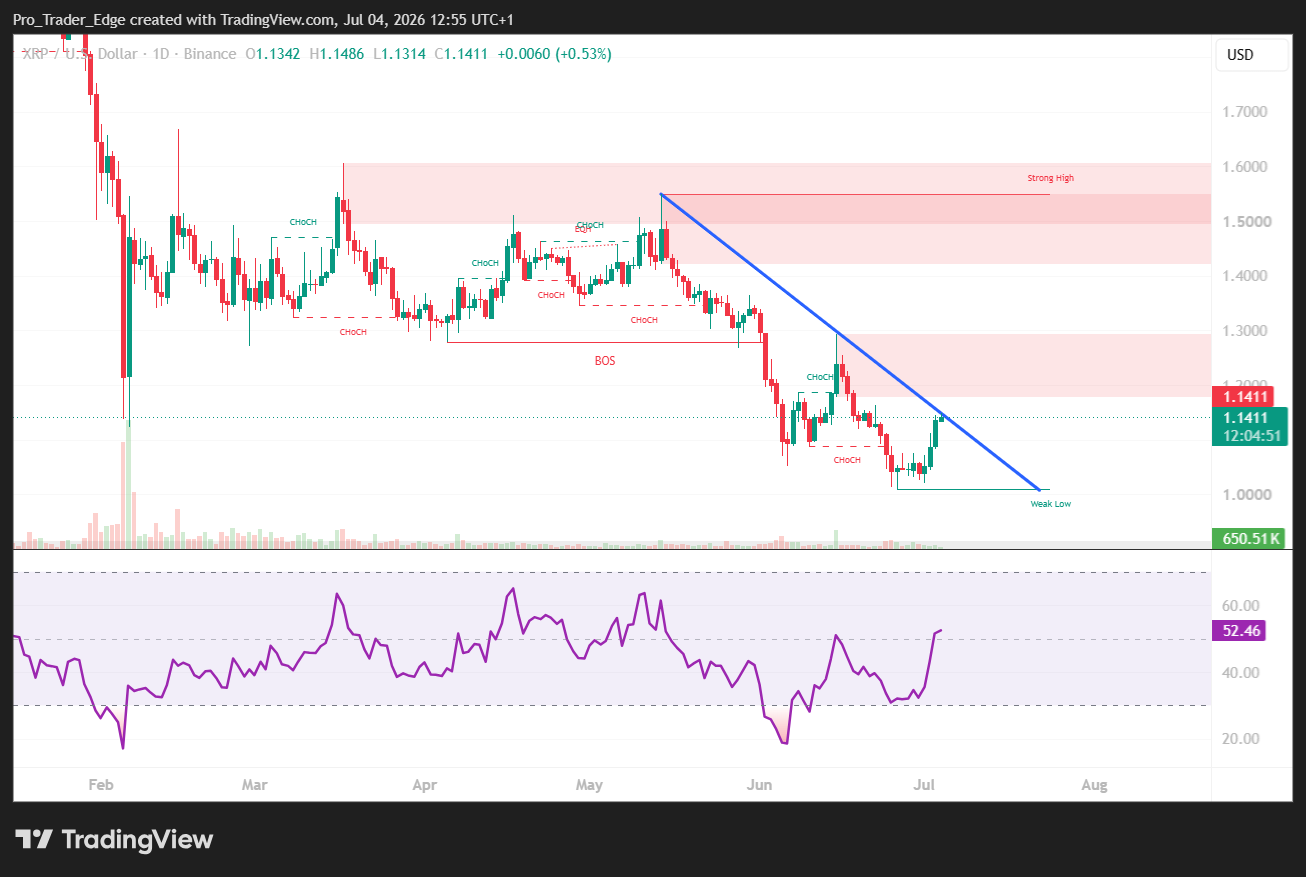
Analyst Ali Martinez posted on X on July 3 that the Supertrend indicator had just flashed a buy signal on XRP for the first time since mid-June. He noted: “The last buy signal preceded a 14% rally.” Martinez also pointed out that the same indicator correctly identified the prior 19% and 16% declines, giving the current signal some historical credibility.
XRP: BUY SIGNAL
The SuperTrend indicator has just flashed a buy signal on $XRP for the first time since mid-June.
The last buy signal preceded a 14% rally.
It has also done an excellent job identifying trend reversals, catching the last two major declines of 19% and 16%. pic.twitter.com/tftPM7EaLC
— Ali Charts (@alicharts) July 2, 2026
ETF inflows also returned after a brief pause. After two consecutive days of outflows, US-listed XRP ETFs saw nearly $7 million flow back in on Thursday. Cumulative inflows now stand at $1.49 billion, up from $1.43 billion on June 1. Total assets under management average $988 million.
Ripple’s move into European markets added to the positive sentiment. Ripple Payments launched under preliminary Crypto-Asset Service Provider approval through the EU’s Markets in Crypto-Assets (MiCA) framework. This came as some rival platforms scaled back their European services to meet MiCA compliance requirements.
Investors also largely shrugged off concerns about Ripple’s monthly 1 billion XRP escrow release, recognizing that most unlocked tokens are historically returned to escrow rather than sold.

Technical Picture Points Higher
On the daily chart, XRP has broken above a descending trendline that had held every rally back since late May. The breakout reclaimed the $1.10 level and put the $1.12 resistance zone in focus.
The MACD shows a bullish crossover with expanding positive histogram bars. The RSI sits in the mid-60s — firm but not yet overbought.
XRP also trades above its 50-day EMA at $1.07 and 100-day EMA at $1.09. The upper Bollinger Band near $1.11 is the nearest resistance, with the 200-day EMA sitting at $1.14.
Short Squeeze Potential Builds
CoinGlass liquidation data shows a dense cluster of short positions sitting just above current price, between $1.11 and $1.12. XRP has already begun pushing into that zone.
A second cluster of leveraged short positions sits near $1.14. If buying pressure continues, forced short covering could push price higher toward that level.
Futures Open Interest stands at 2.2 billion XRP on Friday, marginally up from 2.18 billion the day before, staying below the June peak of 2.28 billion XRP.
On-chain data from Santiment shows XRP’s average trading returns have fallen to their lowest point in roughly 12 years, placing many holders underwater.


