


TLDR
- XRP is trading at $1.12, up 1.82% in 24 hours with a market cap of $69.45 billion
- Price broke above a bearish trend line at $1.10 and cleared the 23.6% Fibonacci retracement level
- Key resistance sits at $1.1720, then $1.2080 — a break above $1.2080 could push toward $1.2450
- If bulls fail at $1.1740, downside support levels are at $1.1250, $1.110, and $1.050
- Analyst Ali Charts says $0.90 could be a strong long-term buying level if price drops that far
XRP has bounced back above the $1 mark after a period of selling pressure, with the price sitting at $1.12 at time of writing. The coin posted a 24-hour gain of 1.82%, with trading volume at $2.93 billion and a market cap of $69.45 billion.
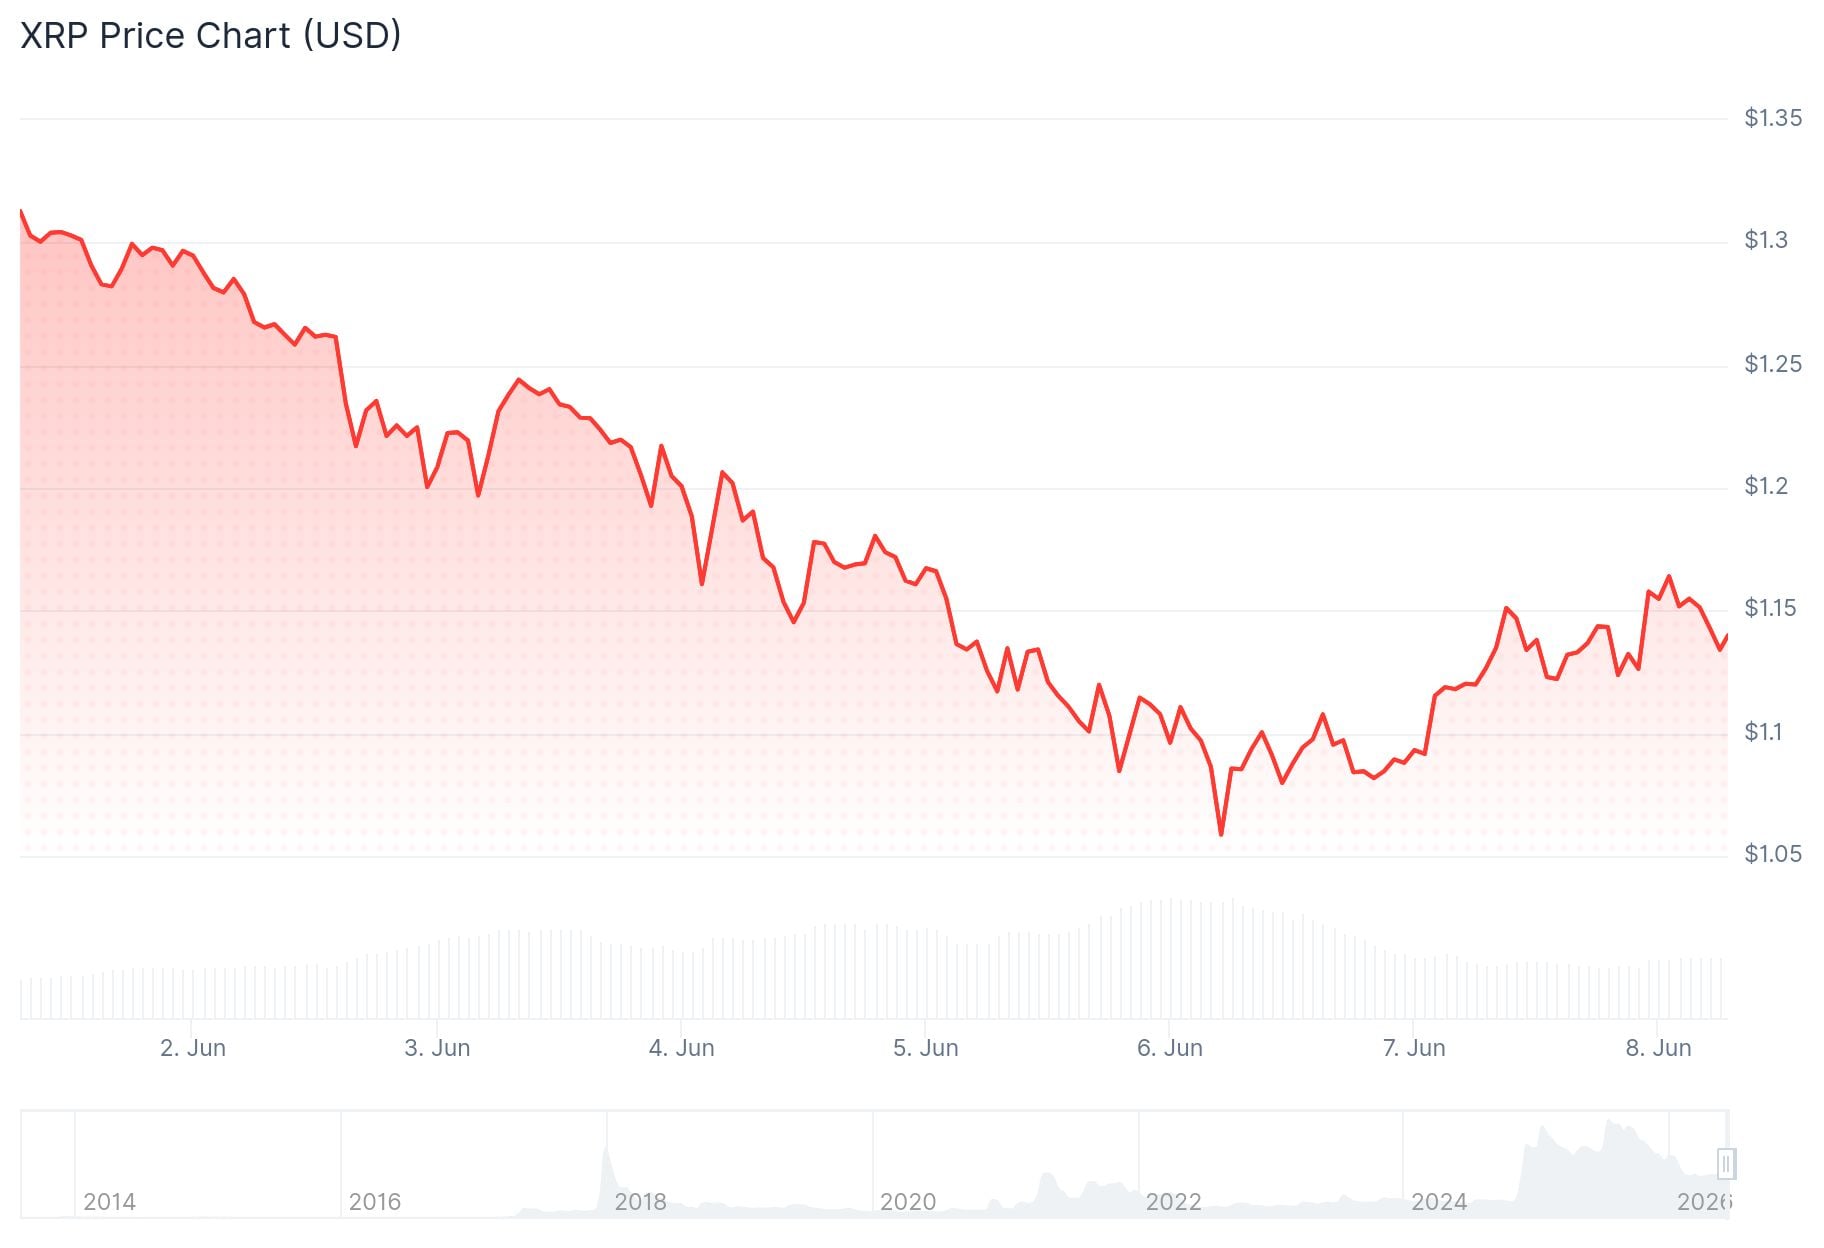
The recovery started after XRP held support above $1.050. From there, buyers pushed the price above $1.10 and then $1.120, breaking through a bearish trend line that had been holding as resistance on the hourly chart.
XRP also cleared the 23.6% Fibonacci retracement level of the drop from the $1.3640 high to the $1.052 low. The price is now trading above the 100-hourly Simple Moving Average.
Analyst Ali Charts posted on X that he is watching the $0.90 level on XRP closely, saying that if price reaches that point, it could offer a compelling long-term buying opportunity.
I’m watching $0.90 closely on $XRP.
If price gets there, I think it could offer a compelling long-term buying opportunity. pic.twitter.com/KcYXI40Bcd
— Ali Charts (@alicharts) June 7, 2026
Key Resistance Levels to Watch
The first major hurdle is at $1.1720. A clean break above that level would open the door toward $1.2080, which lines up with the 50% Fibonacci retracement level. Above that, the next targets are $1.2150, $1.220, and $1.2450.
What Could Push Price Lower
If XRP stalls at $1.1740 and fails to break higher, the price could pull back. Initial support sits at $1.1250, followed by $1.110. A drop below $1.110 could see the price slide toward $1.080 and then the $1.050 zone.

The RSI is at 25.40, still in oversold territory, though a bounce suggests selling pressure may be slowing. The MACD line remains below the signal line at -0.0700 versus -0.0476, pointing to continued bearish momentum in the short term.
Analyst Crypto Patel noted on June 7 that XRP is currently trading around 37,000% above its 2017 lows. He stated his buying range is between $1.00 and $0.60, and said that if XRP reaches $10–$20 in future cycles, current price levels could look like strong entry points in hindsight.
$XRP – The Same Price, Two Completely Different Emotions:
Think Back To 2017. #XRP Was Trading Around $0.003, And Every XRP Holder Had Just One Dream – "One Day This Will Hit $1." That Was The Whole Fantasy. And In December 2017, It Finally Happened. XRP Crossed $1. It Was Party… pic.twitter.com/tYx0VdujP6
— Crypto Patel (@CryptoPatel) June 7, 2026
The MACD histogram reading of -0.0224 shows that bears still have an edge, and bulls would need a positive MACD crossover before momentum shifts clearly to the upside.


