






TLDR
- DOGE trades near $0.0750 after falling about 25% from early-October highs near $0.10.
- The coin sits below the $0.0792 resistance level, with $0.068 as the next major support.
- Dogechain data shows weekly transactions down 41% from a year earlier.
- US Dogecoin ETFs have drawn about $15.1 million in total net inflows.
- Analyst Trader Tardigrade says the monthly oscillator is in a zone that marked a past bottom.
Dogecoin (DOGE) traded near $0.0750 on Wednesday, November 4. The meme coin has slid about 25% since early October, when it was close to $0.10.
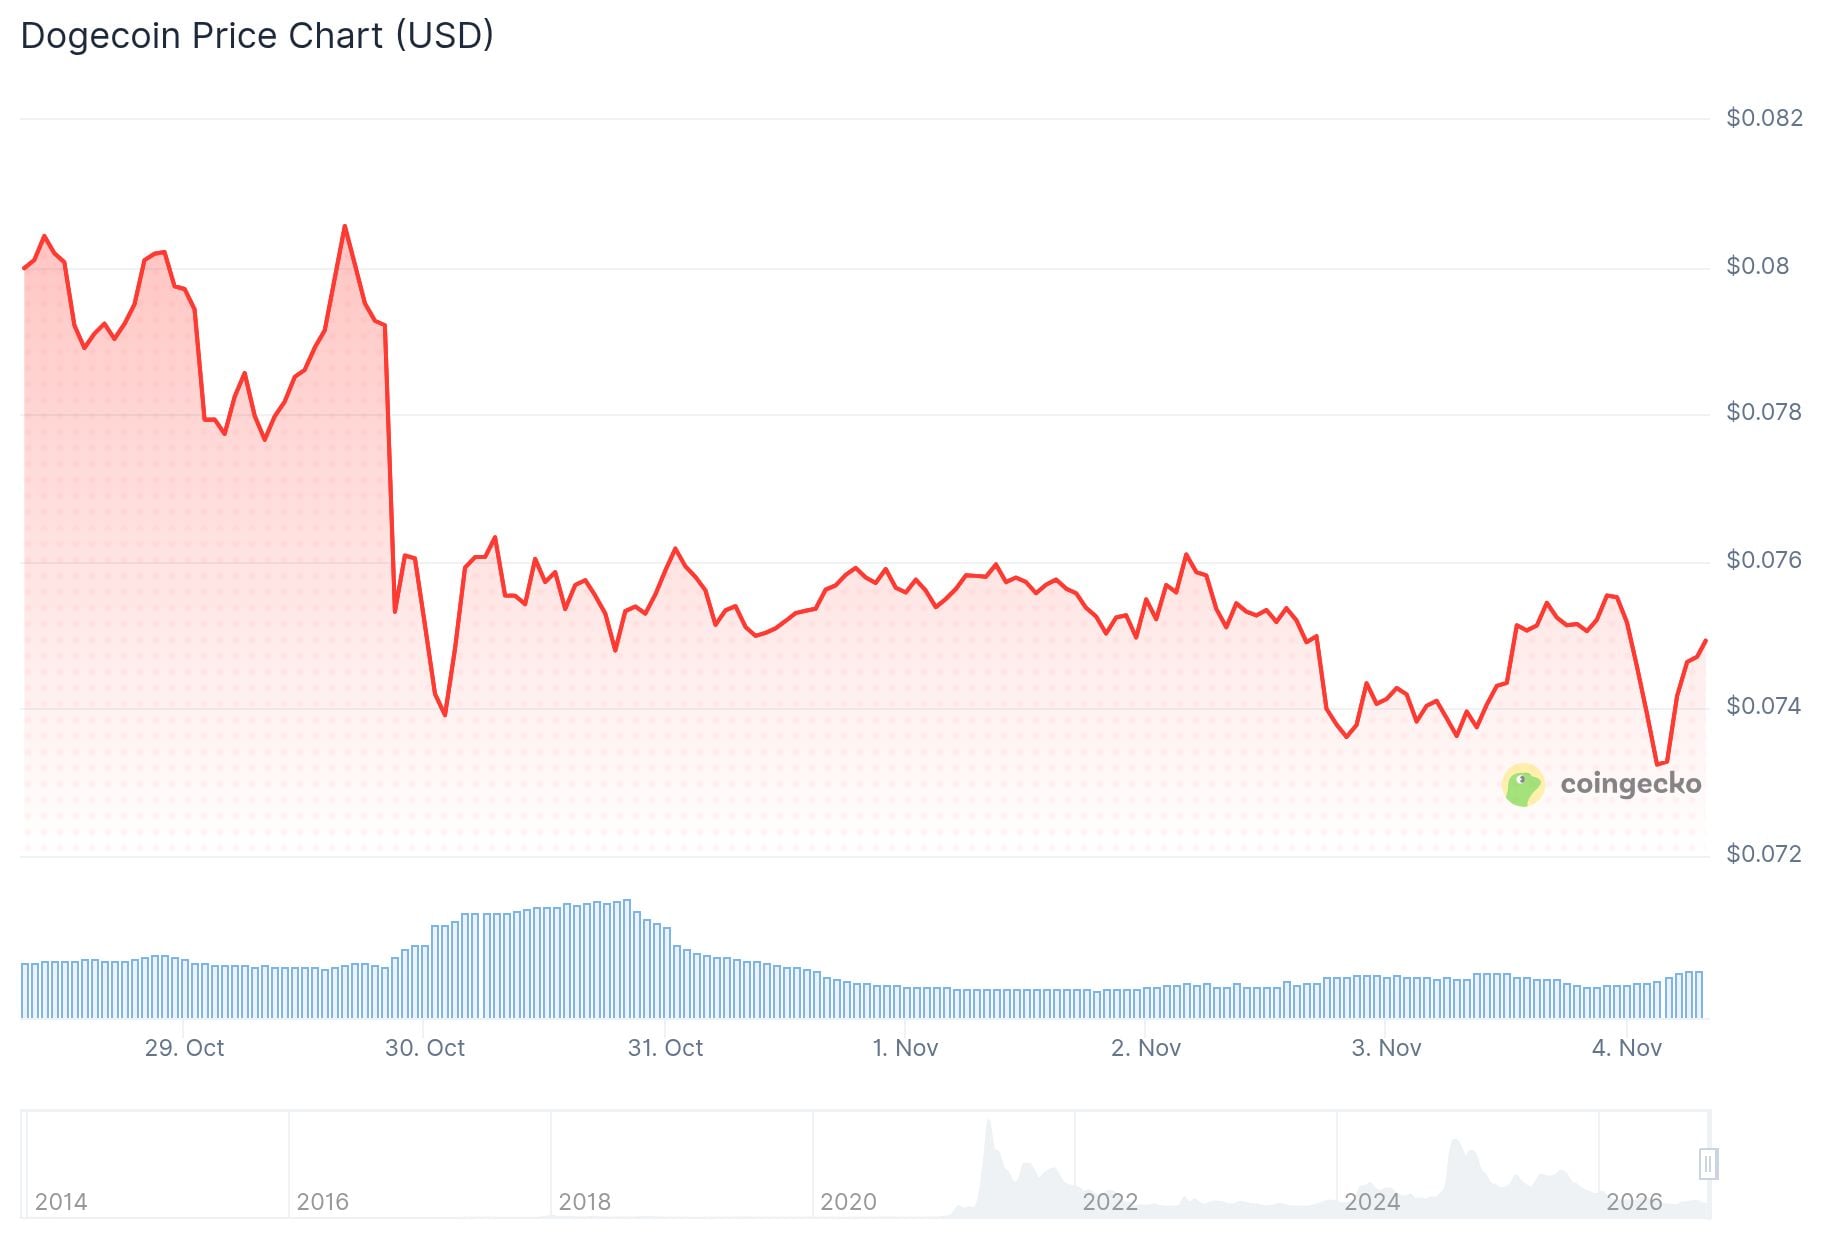
DOGE has fallen below an ascending trendline that had held since August. It also sits under the $0.0792 level, which now acts as the first resistance.
The intraday low so far was $0.0725. The first support area sits between $0.072 and $0.073, with $0.068 below that.
Network Activity Falls From Last Year
Dogechain data shows the network handled about 156,972 transactions in the week starting October 28. That is 41% fewer than in the same week a year ago.
Average daily active addresses were near 32,659, down about 42% from last year. The network also logged 61,510 new addresses in the week, a 55% annual drop.
Lower activity does not always lead to lower prices. DOGE is driven heavily by exchange trading, so price and network use can move apart.
Markets also reacted to the US midterm elections. Reuters reported on November 4 that Democrats had won control of both chambers of Congress.

Bitcoin and Ethereum first dipped after the results. DOGE often moves more sharply than the larger coins during market swings.
Work on the Dogecoin ecosystem is still going. On October 21, House of Doge announced an agreement to support the new Dogecoin Labs.
The group combines MyDoge, a consumer wallet app, with DogeOS. DogeOS is an Ethereum Virtual Machine-compatible layer built to bring smart contracts to Dogecoin.
House of Doge also plans to expand its tokenisation work, aimed at alternative investments.
ETF Flows Stay Small
According to CryptoETF.today, US Dogecoin ETFs had taken in about $15.1 million in total net inflows as of November 2. Total assets in the funds were near $12.9 million.
The tracker showed no net creations or redemptions on November 2. Over the past 30 sessions, net inflows came to about $1.8 million. Some funds have not finished reporting, so the figures may change.
On the daily chart, DOGE was rejected near $0.10 in late September. It had been making higher lows since finding support near $0.07 in August.
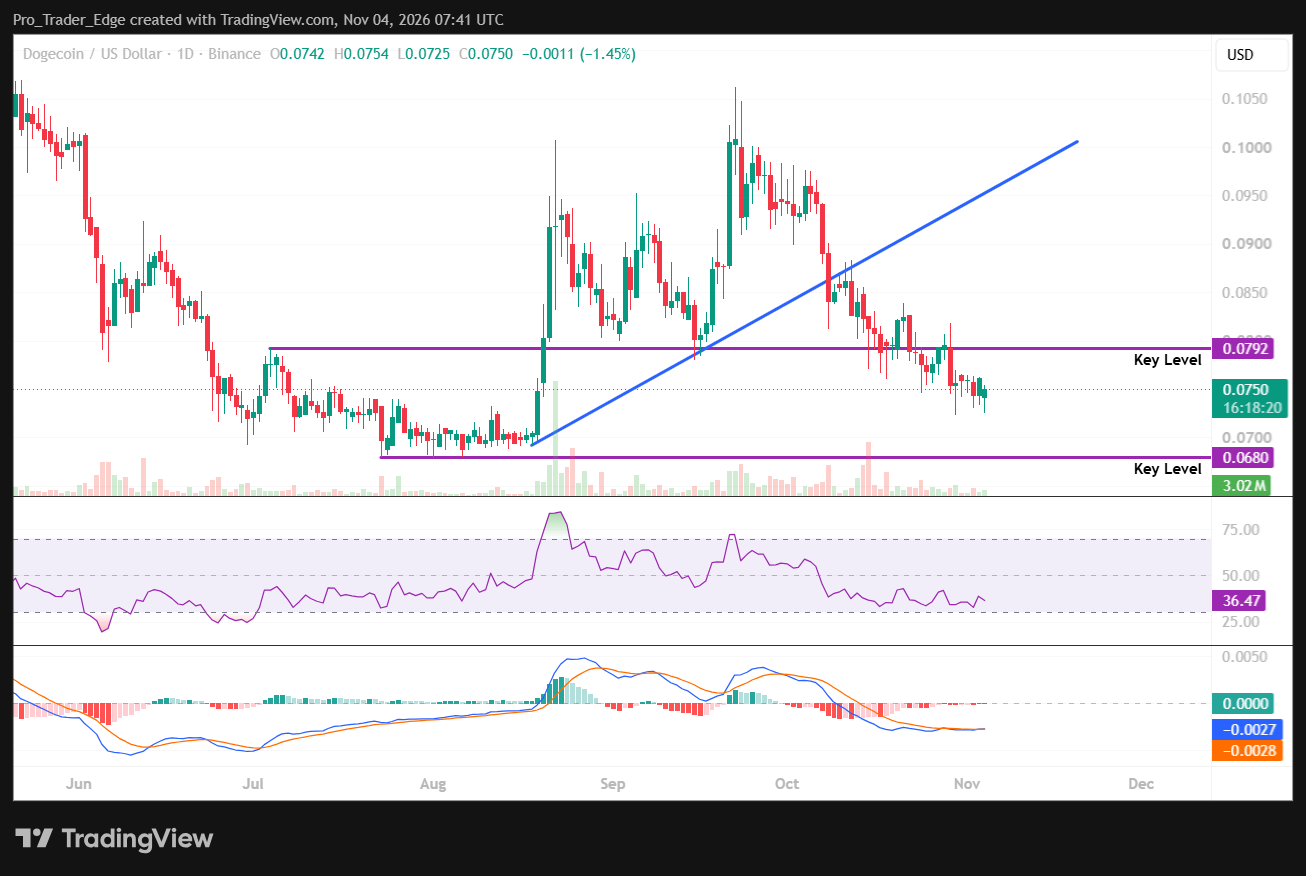
The price then dropped below the trendline near $0.085 in early October. Since then it has printed lower highs.
Momentum readings remain soft. The Relative Strength Index (RSI) is at 36.47, below the neutral 50 mark but above the oversold level of 30.
The MACD line is near -0.0027, just above its signal line at -0.0028. The histogram is hovering around zero.
Analyst Trader Tardigrade, posting on X as @TATrader_Alan, took a longer view on the monthly chart. He said DOGE is in the “discount zone” again.
$DOGE/monthly#Dogecoin is sitting in the discount zone again ❇️
The last time the oscillator spent this long down here, it marked the bottom before the next big run.
The same setup is playing out now, and the window is closing fast.
Catch the opportunity before it's too late… pic.twitter.com/yXIHiLhE3i
— Trader Tardigrade 🧬 (@TATrader_Alan) November 4, 2026
He noted that the last time the oscillator stayed this low for this long, it marked the bottom before the next big run. He said the same setup is now playing out.
If buyers reclaim $0.0792, the next resistance sits at $0.083 to $0.085, where the broken trendline lies. Above that, $0.09 and the $0.095 to $0.10 zone come into view.
On the downside, a daily close below $0.068 would put $0.065 and $0.06 in focus. The $0.068 level held prices during August’s consolidation.
DOGE was trading near $0.075 on Wednesday, with the $0.072 to $0.073 area as the nearest support.


