





TLDR
- Solana (SOL) trades near $92.91 on Wednesday, November 4, after an intraday low of $89.73.
- SOL is down about 25% from its late-September high near $124.
- US spot Solana ETFs lost about $71.6 million between October 26 and October 30.
- The daily RSI sits at 29.50, just under the oversold line of 30.
- Analyst Jesse Olson points to a pending daily reversal candle with no confirmation yet.
Solana (SOL) was trading near $92.91 on Wednesday, November 4. The token had earlier dipped to an intraday low of $89.73 before buyers pushed it back higher. The daily candle is still open, so the day’s close is not set.
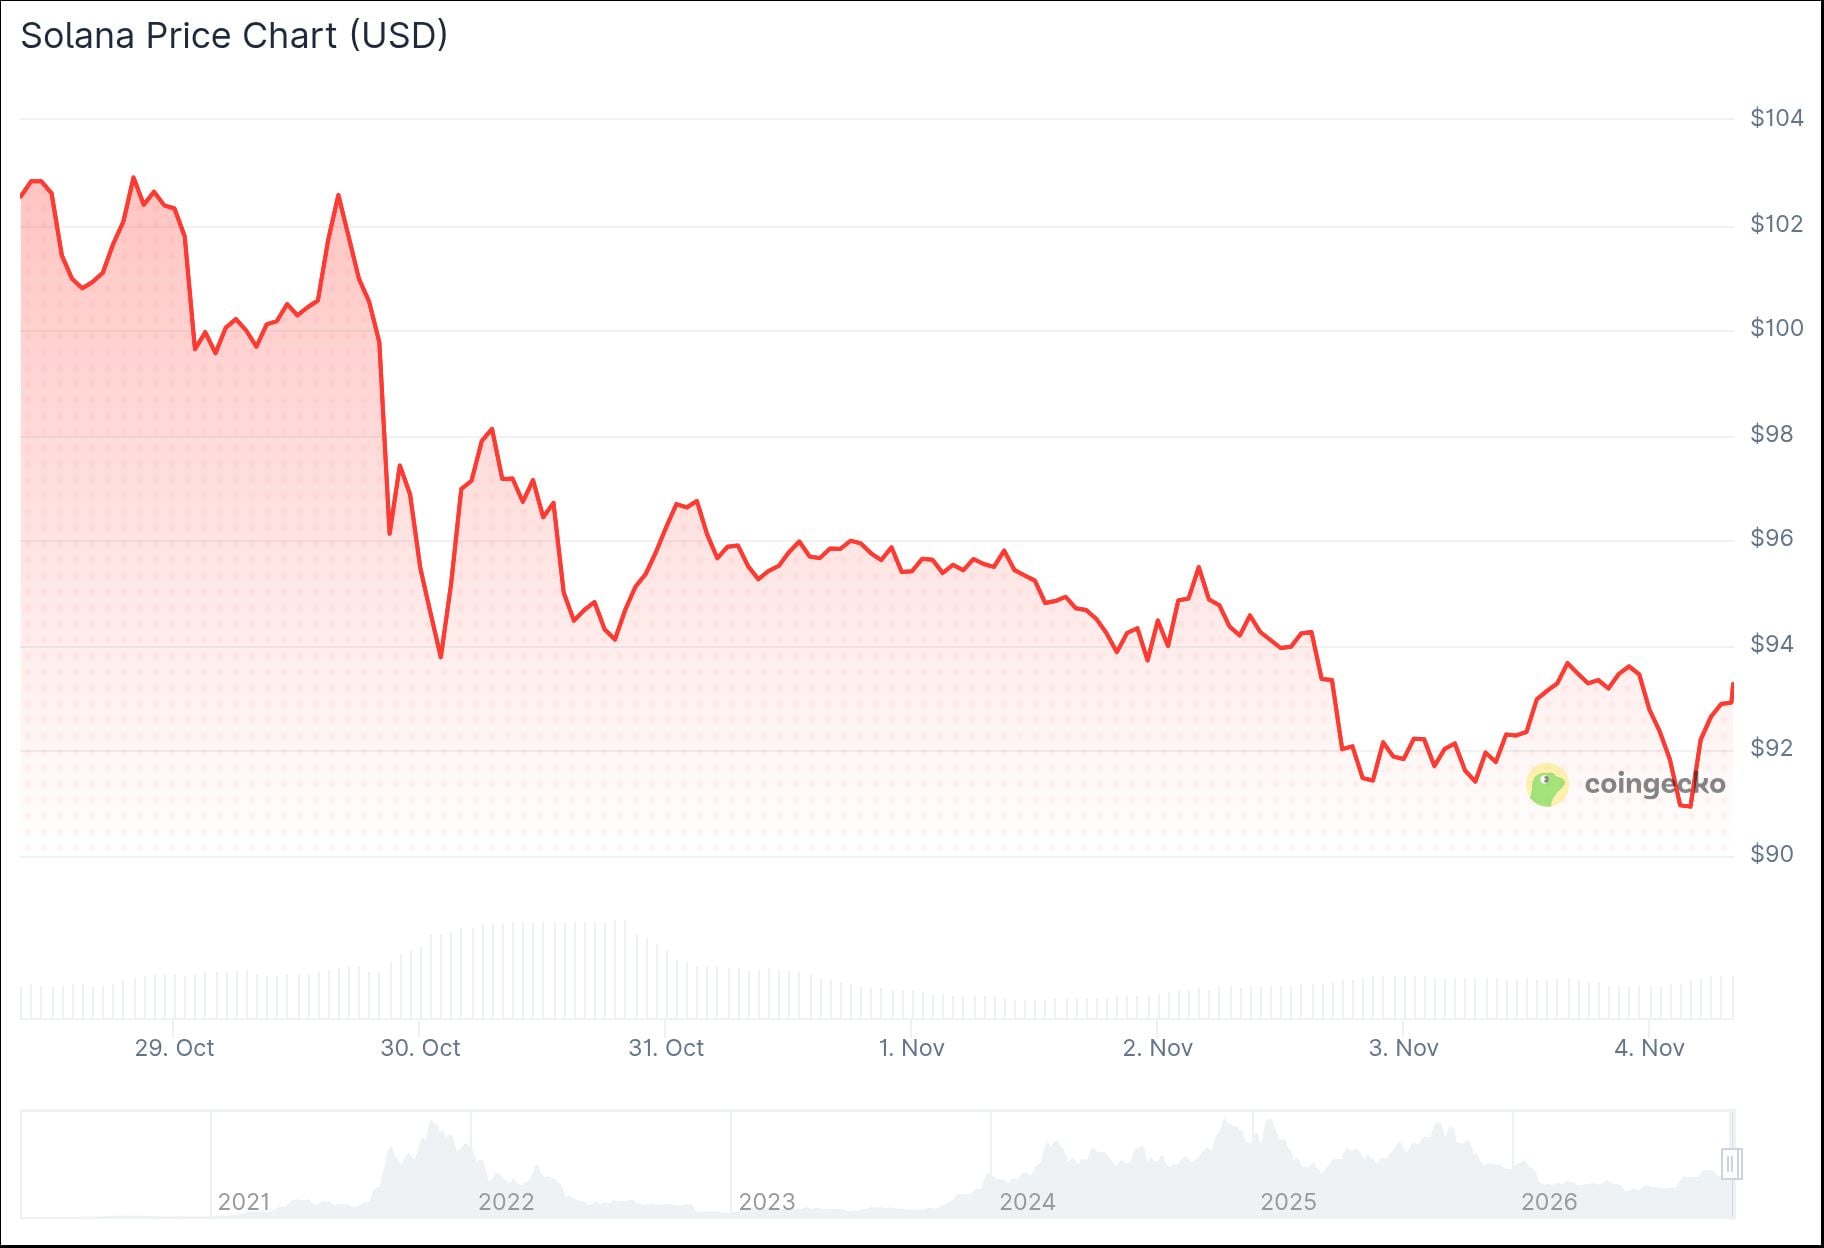
SOL has fallen about 25% since late September, when it reached roughly $124. Since then, the price has formed a series of lower highs and lower lows. That pattern shows sellers have held the upper hand in the short term.
The drop has brought SOL close to an ascending trendline near $90. The line began after SOL fell toward $60 in June. It supported the recovery through July, August and September.
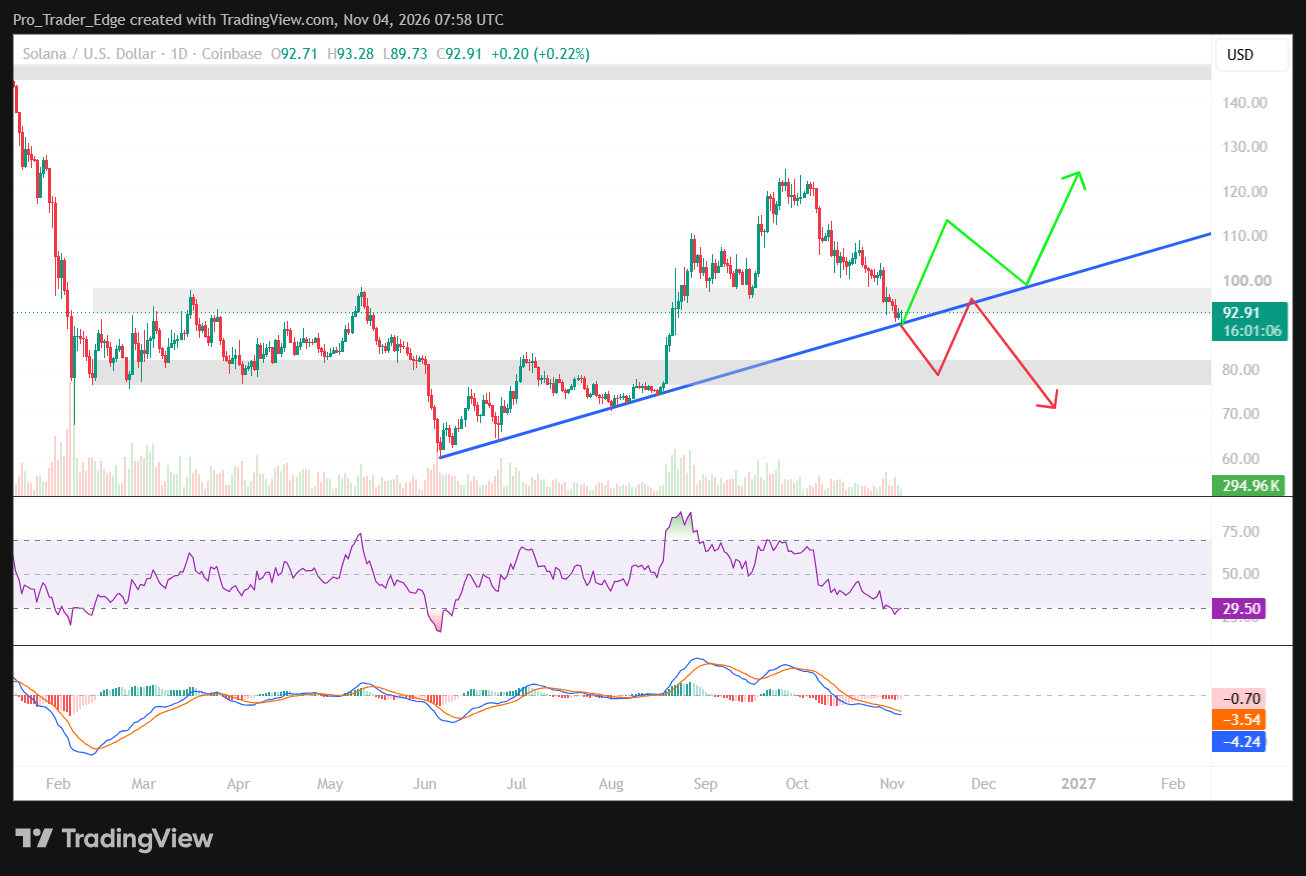
Analyst Jesse Olson shared his view of the daily chart on X. He said SOL has a pending reversal candle, along with oversold blue candles. He added that there are no confirmations yet and that his lower target remains in place.
$SOL has a pending reversal candle on the daily chart.
Signs of a reversal: Oversold blue candles + Reversal candle
No confirmations as of yet, lower target remains. pic.twitter.com/S313gx2ebw
— Jesse Olson (@JesseOlson) November 3, 2026
Momentum Indicators and ETF Flows
The daily RSI reads 29.50. That is just below the 30 level that traders often treat as oversold. The MACD line is at -4.24, under its signal line at -3.54, with a histogram reading of -0.70.
US-listed spot Solana ETFs recorded about $10.8 million in net outflows on October 30. That followed $27.7 million in outflows on October 29. Combined withdrawals from October 26 to October 30 reached about $71.6 million.

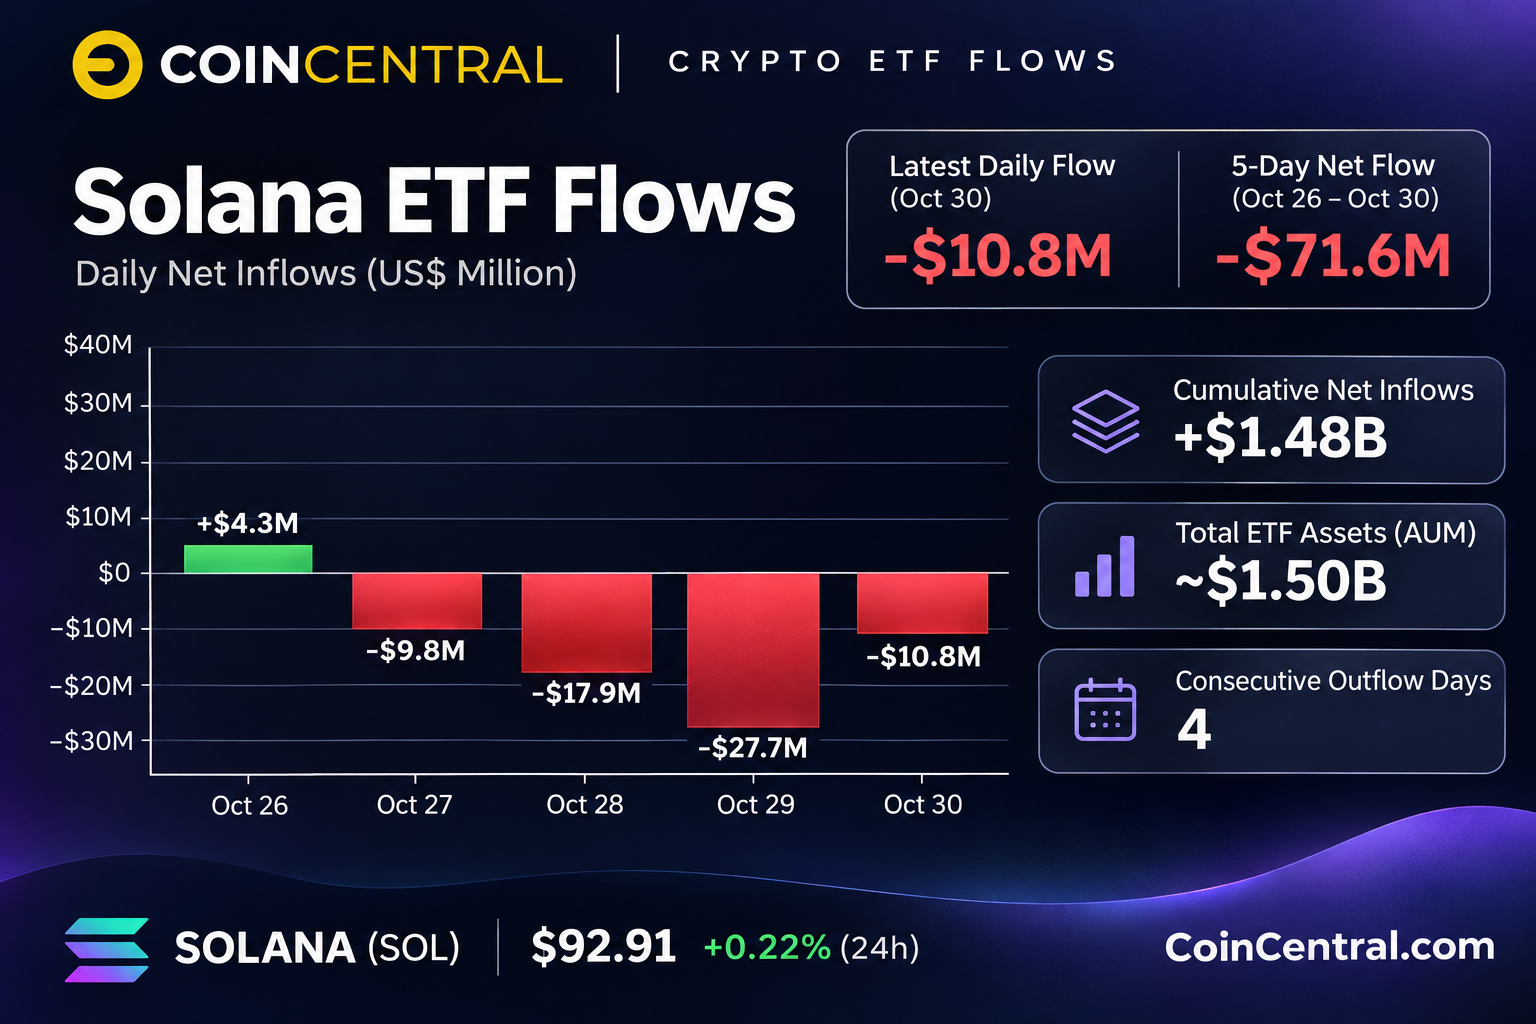
Bitwise’s BSOL accounted for $9.3 million of the October 30 outflows. Other funds saw smaller redemptions. Cumulative ETF inflows since launch remain positive.
Reporting for November 3 is still incomplete. That makes it unclear whether ETF demand has picked up again.
Network activity has stayed high. DefiLlama data for November 4 shows about 97.8 million transactions over 24 hours. The network also counted 2.78 million active addresses.
Decentralized exchange volume reached about $1.78 billion in the same period. Total value locked in Solana DeFi stood near $5.38 billion.
Liquidity measures have weakened, though. Seven-day DEX trading volume fell about 15%. Stablecoin market capitalization on Solana dropped 5.63% to $14.63 billion.
Ecosystem Updates and Price Levels
The Solana ecosystem published an update on November 3 on tokenization and network use. It put tokenized equity supply on the network at about $684 million. It also noted billions of non-vote transactions.
Samsung has announced plans to add USDC transfers on Solana to Samsung Wallet. The company is targeting about 82 million Galaxy devices in the United States.
Solana has also introduced delivery-versus-payment infrastructure. It is designed for the settlement of tokenized financial assets between institutions.
On the upside, the first resistance area sits at $95 to $98. A move back above $100 would put SOL over a key psychological level. Beyond that, resistance appears near $110 to $115, with September’s high around $120 to $124 above it.
On the downside, a daily close below the trendline would put $85 in view first. The next demand zone lies between $75 and $82, where SOL found support during the summer. A move under $75 would open the way toward $70, and the June low near $60 sits below that.
A bullish MACD crossover would be one sign that selling pressure is easing. An RSI recovery above 40 would be another. Neither signal has appeared yet.
SOL is holding the $89 to $92 area as the Wednesday session continues.


