






TLDR
- ETH trades near $1,795 after a weekly drop of about 15.3%.
- Weekly RSI is 36.27 and the MACD has turned bearish.
- Support sits at $1,700 to $1,800, with $1,500 below it.
- US spot Ethereum ETFs saw about $399 million in net outflows last week.
- CoinShares sets a 2031 base case of $4,935 for ETH.
Ethereum (ETH) is trading near $1,795 on November 15 after a weekly drop of about 15.3%. The price briefly touched $1,715 during the week.
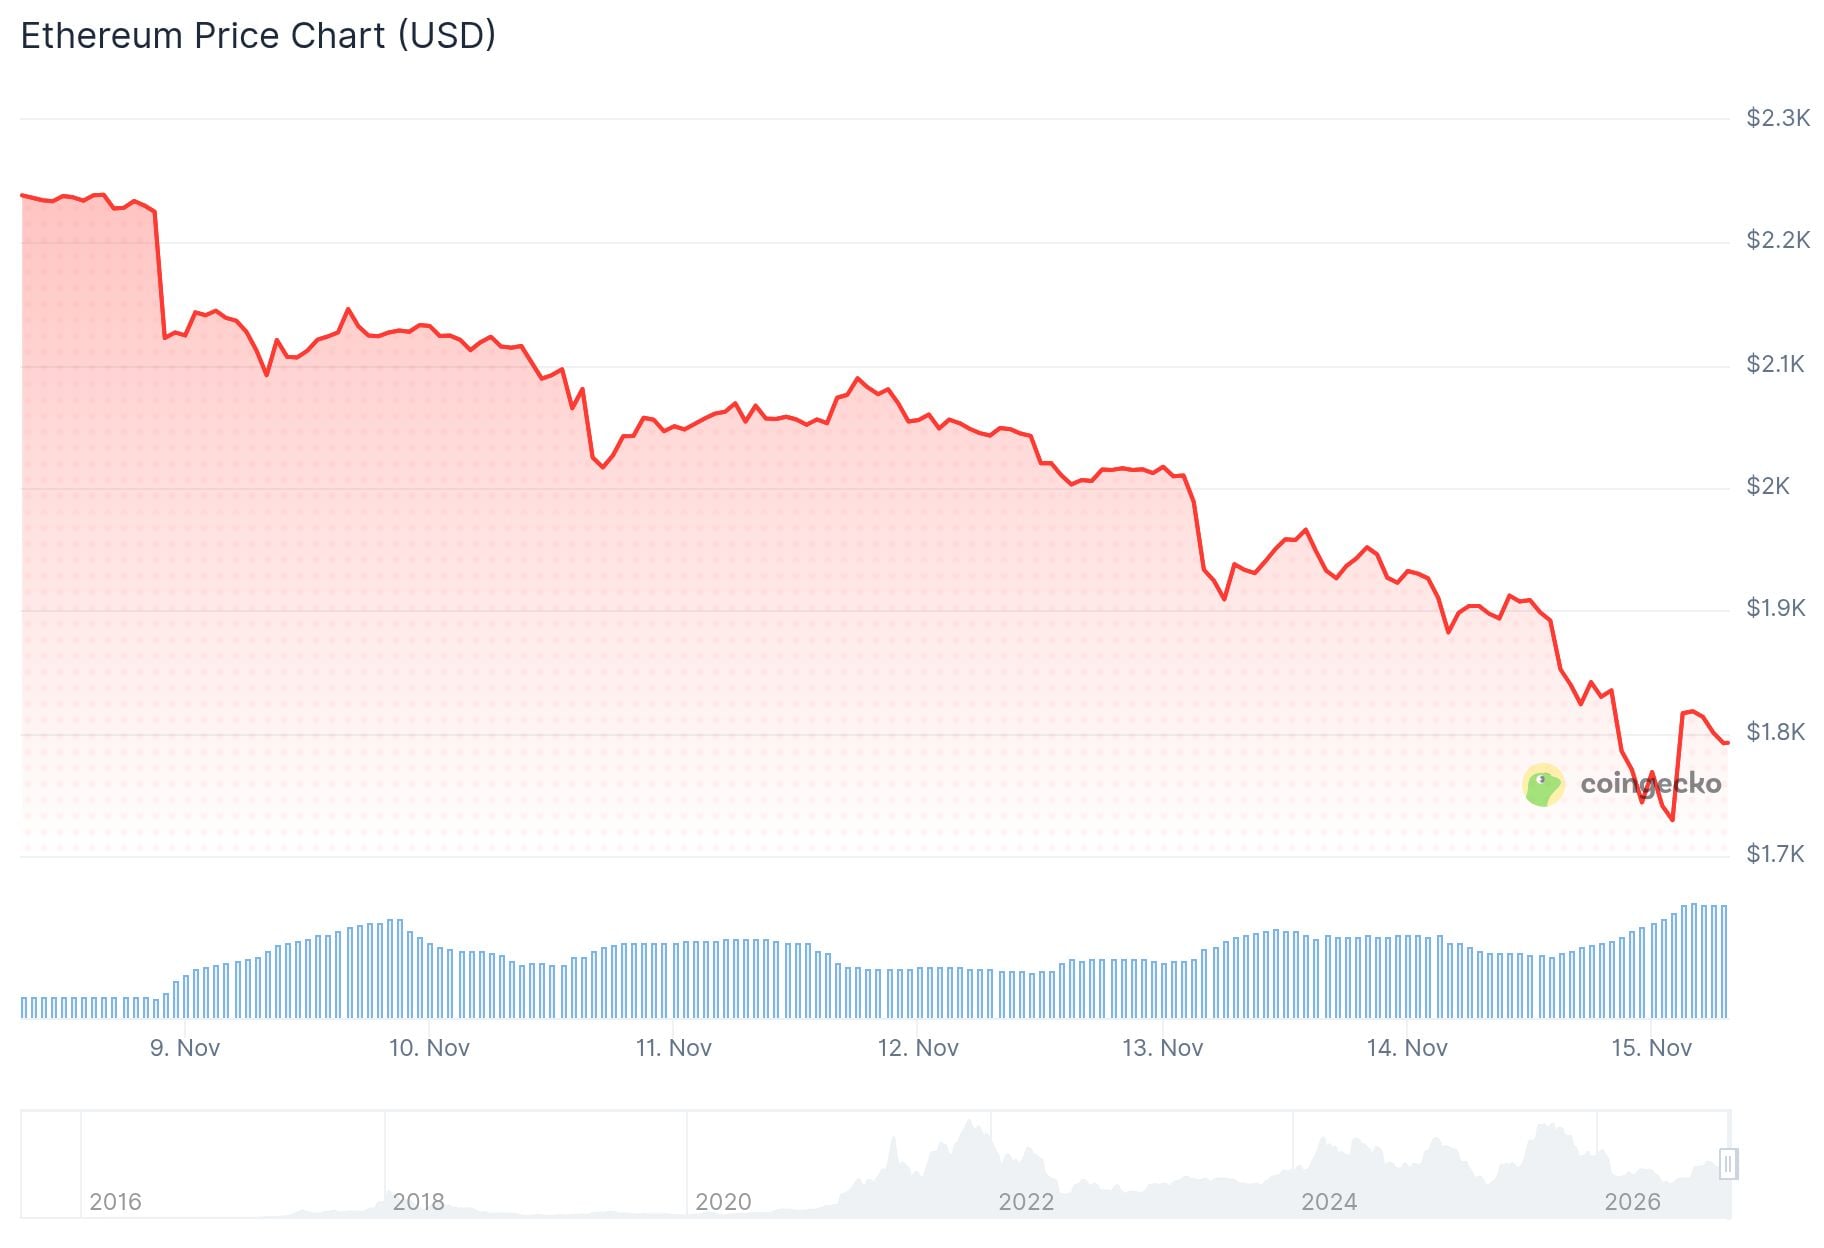
ETH is now more than 60% below its 2025 peak near $4,950. That peak is about $3,155 above the current price.
The decline followed a failed recovery attempt toward $2,700 in October. Momentum on the weekly chart has weakened since then.
The $1,700 to $1,800 zone is the first area traders are watching. Buyers stepped in there during earlier declines.
Ethereum Price Levels and Technical Indicators
The weekly Relative Strength Index (RSI) sits at 36.27. That is close to the 30 level that marks oversold conditions, but it has not reached it yet.
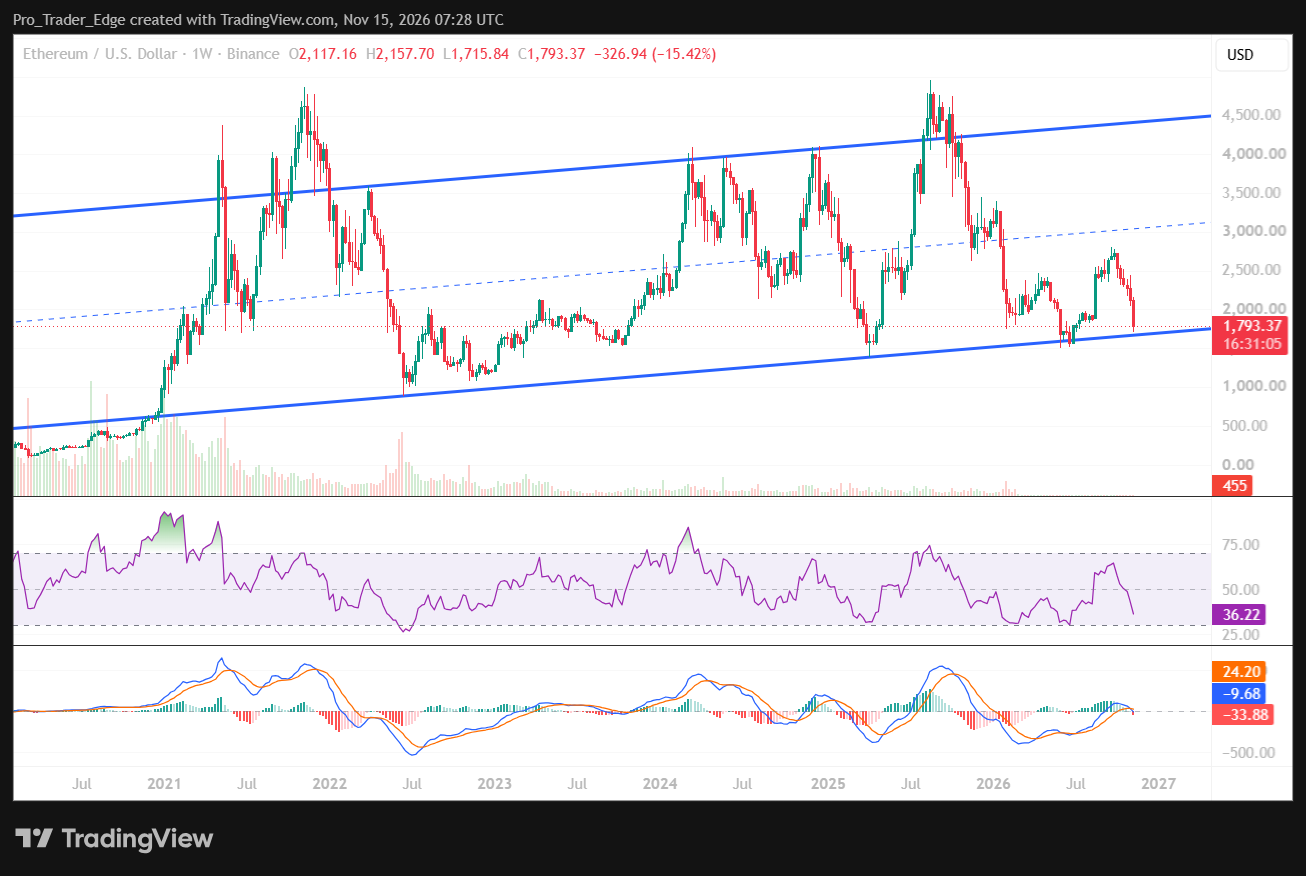
The MACD indicator has also turned bearish on the weekly chart. The MACD line crossed below its signal line, and the histogram is negative.
Below $1,700, the next support sits at $1,500, where ETH set earlier lows. A drop under that level would bring $1,200 to $1,400 into view.

On the upside, resistance sits near $2,000, followed by $2,400 to $2,700. The $2,000 level is about 11% above the current price, and $3,000 would need a gain of roughly 67%.
Analyst Crypto Patel said on X that ETH remains below its major descending trendline. He is focusing on key levels instead of chasing price moves.
ETHEREUM | LONG-TERM OUTLOOK 2026–2027$ETH remains below its major descending trendline. I am focused on key levels rather than chasing price movements.
My planned accumulation zones:
🟢 Zone 1: $1,850–$1,750
🟢 Zone 2: $1,300–$1,000Long-term targets: $7,000 | $10,000 |… pic.twitter.com/FWYePr6czc
— Crypto Patel (@CryptoPatel) November 14, 2026
He listed accumulation zones at $1,850 to $1,750 and $1,300 to $1,000. His long-term targets are $7,000, $10,000 and $15,000, and he plans to wait for market structure confirmation.
His first zone overlaps with the $1,700 to $1,800 support area on the weekly chart. His second zone sits below the $1,500 support level.
Ethereum ETF Flows and Long-Term Forecasts
US spot Ethereum ETFs saw about $399 million in net outflows from November 9 to November 13, according to Farside Investors. Friday brought a small inflow of $2.3 million, and the week ended with ETH down about 15.3%.
CoinShares laid out three 2031 scenarios for ETH in its May 2026 framework. They are $1,443 in the bearish case, $4,935 in the base case and $14,135 in the bullish case. The bearish figure sits about 20% below the current price.
The bullish case assumes faster adoption of stablecoins, decentralized finance and tokenization. It also assumes large institutional inflows.
Standard Chartered projected ETH at $15,000 in 2027 and $30,000 by 2029 in research released in January 2026. Those targets were set before the latest decline.
For the next bull market, possibly in 2027 to 2029, one outlook ranges from $1,200 to $2,500 in a bearish case. The base case spans $4,000 to $6,000, and the bullish case runs from $8,000 to $10,000. Reaching $10,000 would require about 457% upside from current levels.
The Ethereum Foundation is still developing its Glamsterdam upgrade, which targets better scalability and transaction processing. Testing problems with gas-pricing changes have delayed activation on the Hoodi testnet, and developers are checking for compatibility issues.


