






TLDR
- ETH traded near $1,816 on Monday, November 16, close to a trendline dating back to 2020.
- Support sits between $1,700 and $1,800, with $2,000 as the first resistance.
- US spot Ether ETFs saw $398.9 million in net outflows over five sessions.
- Weekly RSI stands at 36.66, and the weekly MACD remains below zero.
- Analyst Doctor Profit is buying spot ETH at $1,830 for the long term.
Ethereum (ETH) traded near $1,816 on Monday, November 16. The price sits close to a rising trendline that dates back to 2020.
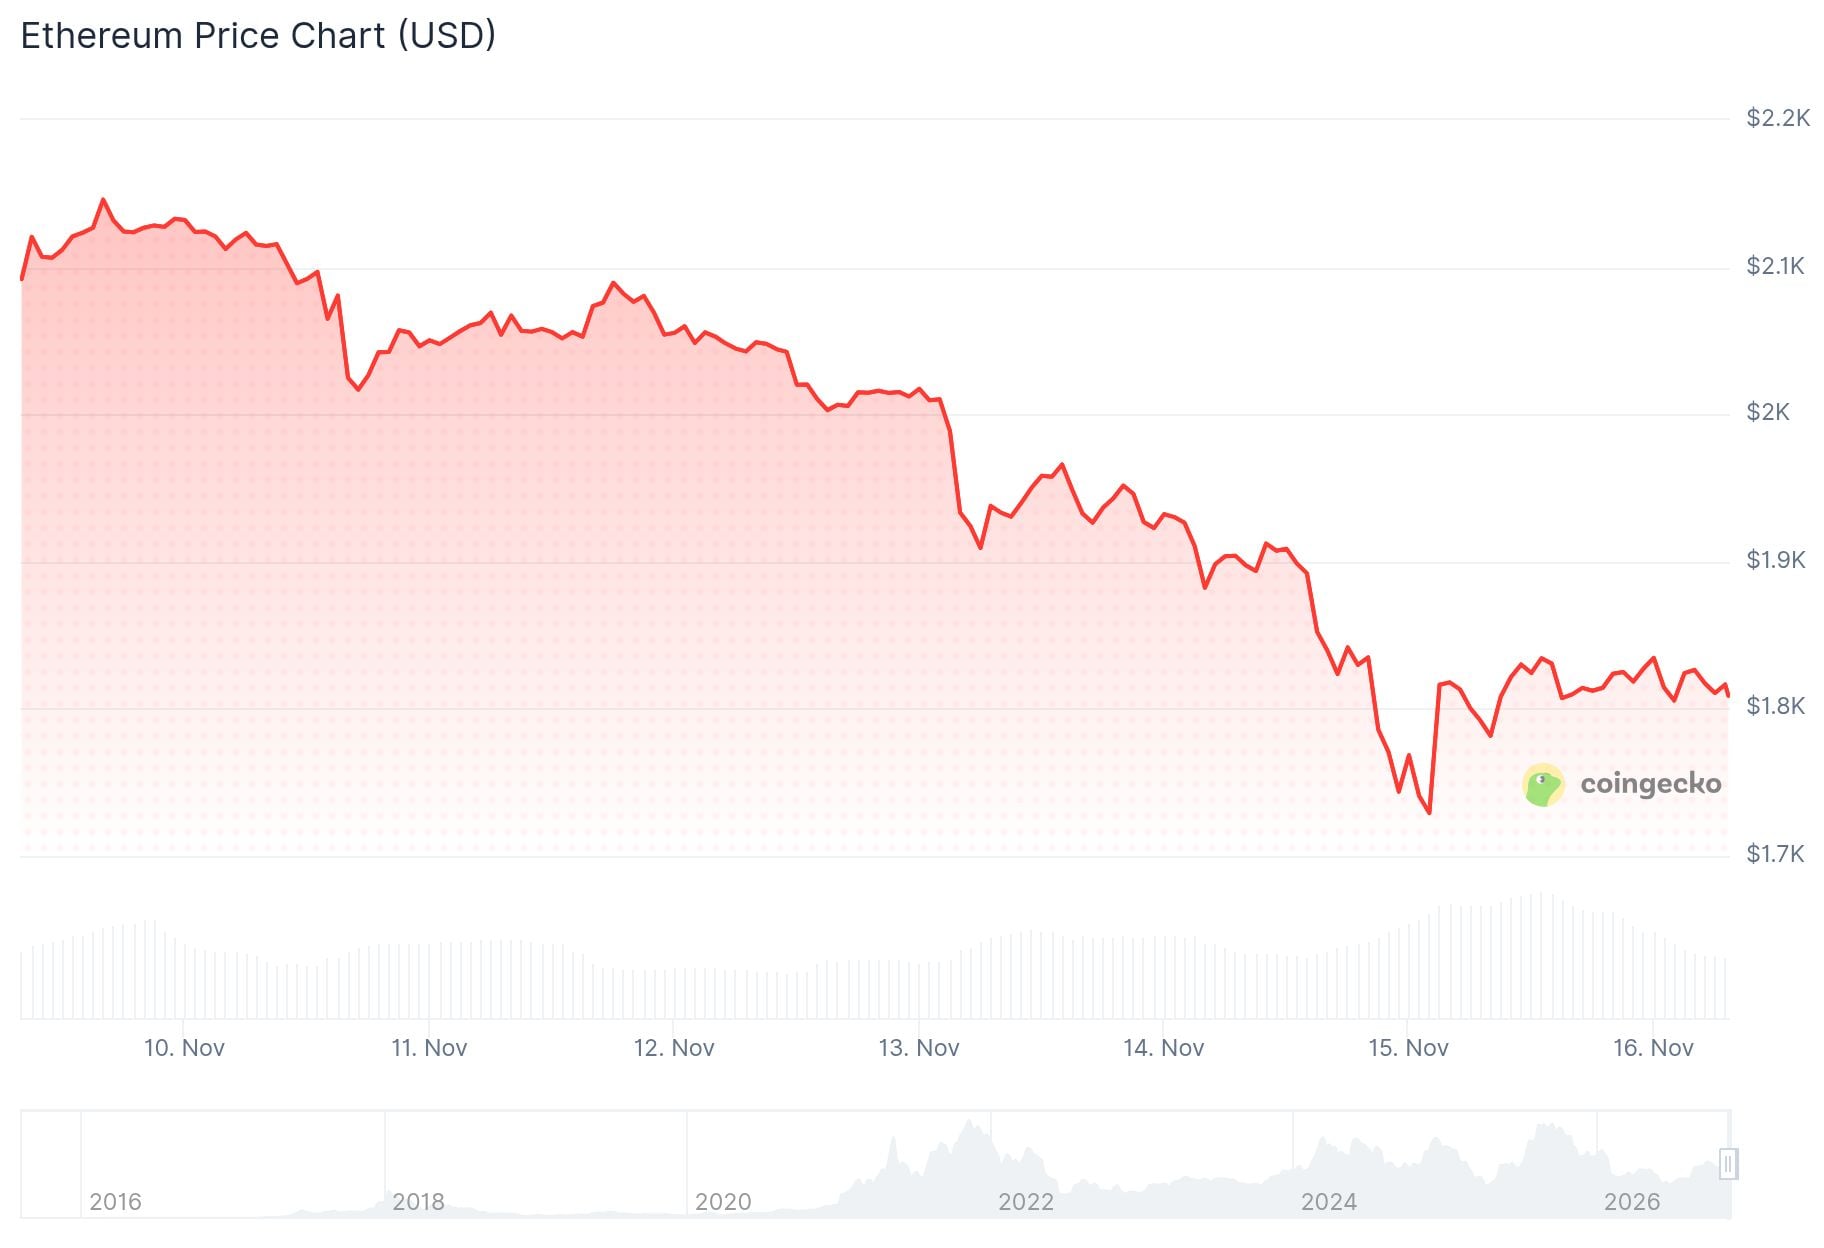
ETH has dropped below $2,000 after months of selling. The weekly chart now shows the price near the lower edge of a multi-year channel.
That channel has held through several market cycles, including the 2022 bear market. Its lower line has acted as support on past dips.
ETH was rejected near $4,500 to $4,800 in 2025 and then formed a series of lower highs. A bounce toward $2,700 this autumn did not last.
Analyst Doctor Profit said on X that ETH is sitting at support that has been forming since 2020. He called it a good place to add, said RSI is oversold, and said he is buying spot at $1,830 for the long term.
$ETH:
Sitting at support that is forming since 2020. Always a great opportunity for me to add more on this line. RSI is in the oversold region. I am buying spot at $1830 for the long term. pic.twitter.com/pnzIbf4YbO
— Doctor Profit 🇨🇭 (@DrProfitCrypto) November 15, 2026
ETF Outflows Weigh on Demand
US spot Ethereum ETFs recorded $144.8 million in net outflows on November 11, according to Farside Investors. Another $70.5 million left the funds on November 12.

Spot Bitcoin ETFs Record $1.065 Billion in Weekly Net Outflows, Extending Streak to Three Weeks
During Nov. 9–13 (ET), spot Bitcoin ETFs recorded net outflows of $1.065 billion, marking their third consecutive week of net outflows. Spot Ethereum ETFs saw $399 million in net… pic.twitter.com/S66L1zEe2b
— Wu Blockchain (@WuBlockchain) November 16, 2026
BlackRock’s ETHA made up $129.8 million of the first day’s outflow and $62 million of the second. On November 13, the funds took in a net $2.3 million, which broke the streak.
Over the five sessions ending November 13, combined net outflows reached about $398.9 million. Total net inflows since launch still stand near $11.55 billion.
Network use remains high. DefiLlama data for November 16 shows about 1.9 million transactions and 779,598 active addresses in 24 hours.
Decentralized exchange volume was about $1.74 billion, and DeFi total value locked was near $37.8 billion. Seven-day DEX volume rose about 12.8%.
Stablecoin market cap fell 2.23% over seven days to about $131.9 billion. Selling grew in November as leveraged positions were liquidated, BeInCrypto reported. It added that sales from Ethereum Foundation-linked wallets were only a small part of the total.
Institutions keep building on the network. Amundi launched a tokenized share class of its Core STOXX Europe 600 fund on Ethereum, Ledger Insights reported.
Key Ethereum Price Levels to Watch
Immediate support sits between $1,700 and $1,800. A hold there could open a rebound toward $2,000, with resistance near $2,200 to $2,400.
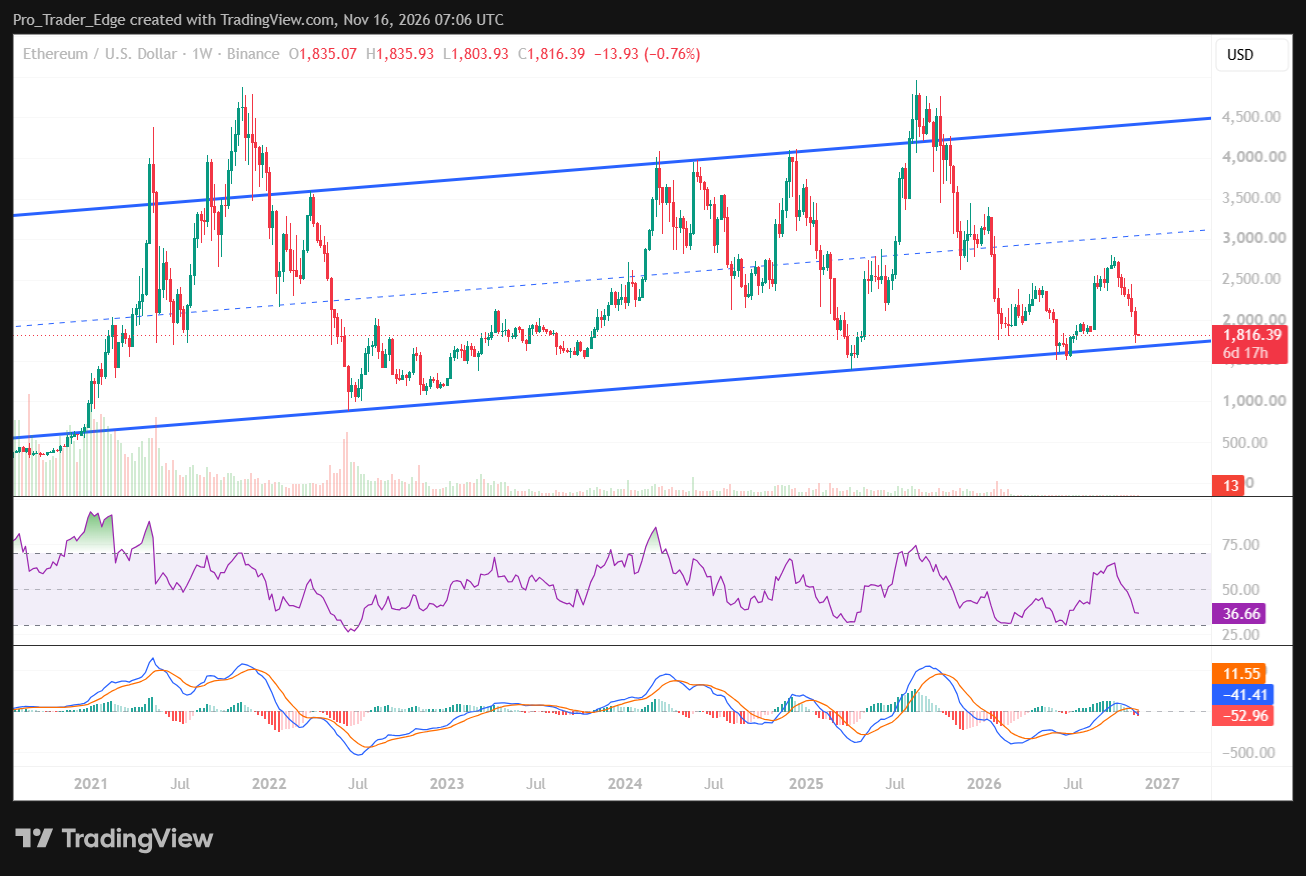
A weekly close below the channel would put $1,500 to $1,600 in view, with $1,200 to $1,300 below that. A move above $2,400 would be the next sign of strength, and $2,700 is the next major resistance.
Weekly RSI stands at 36.66, below the neutral 50 but above oversold territory. The weekly MACD is under zero at -41.41, though it sits above its signal line at -52.96.
The MACD histogram reads 11.55 but has started to weaken. The current weekly candle has only just opened, so a breakdown cannot be confirmed from Monday’s move.


