






TLDR
- XRP trades near $0.9595 on November 16, down 1.53% after losing the $1 level.
- US spot XRP ETFs saw about $19.1 million in net outflows across three sessions this month.
- Franklin Templeton’s ETF held 293.1 million XRP, worth $439.7 million, at the end of September.
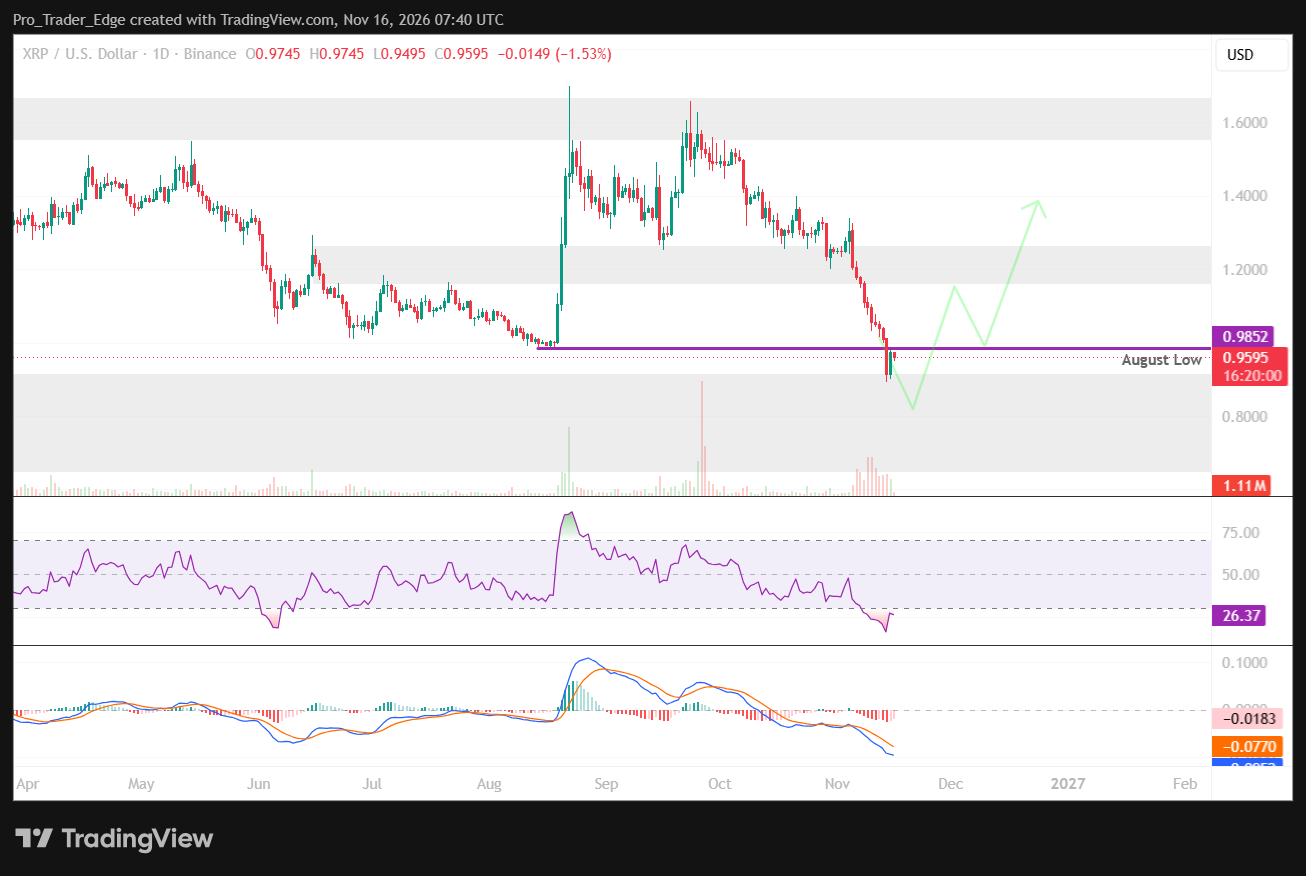
- RSI sits at 26.37 and MACD remains below zero, with $0.90–$0.95 the nearest support.
- ChartNerd says XRP has swept below its 2-month upper regression band only five times in history.
XRP is trading near $0.9595 on Monday, November 16. The token is down 1.53% on the day after it slipped under the $1 mark. Its intraday low reached $0.9495.
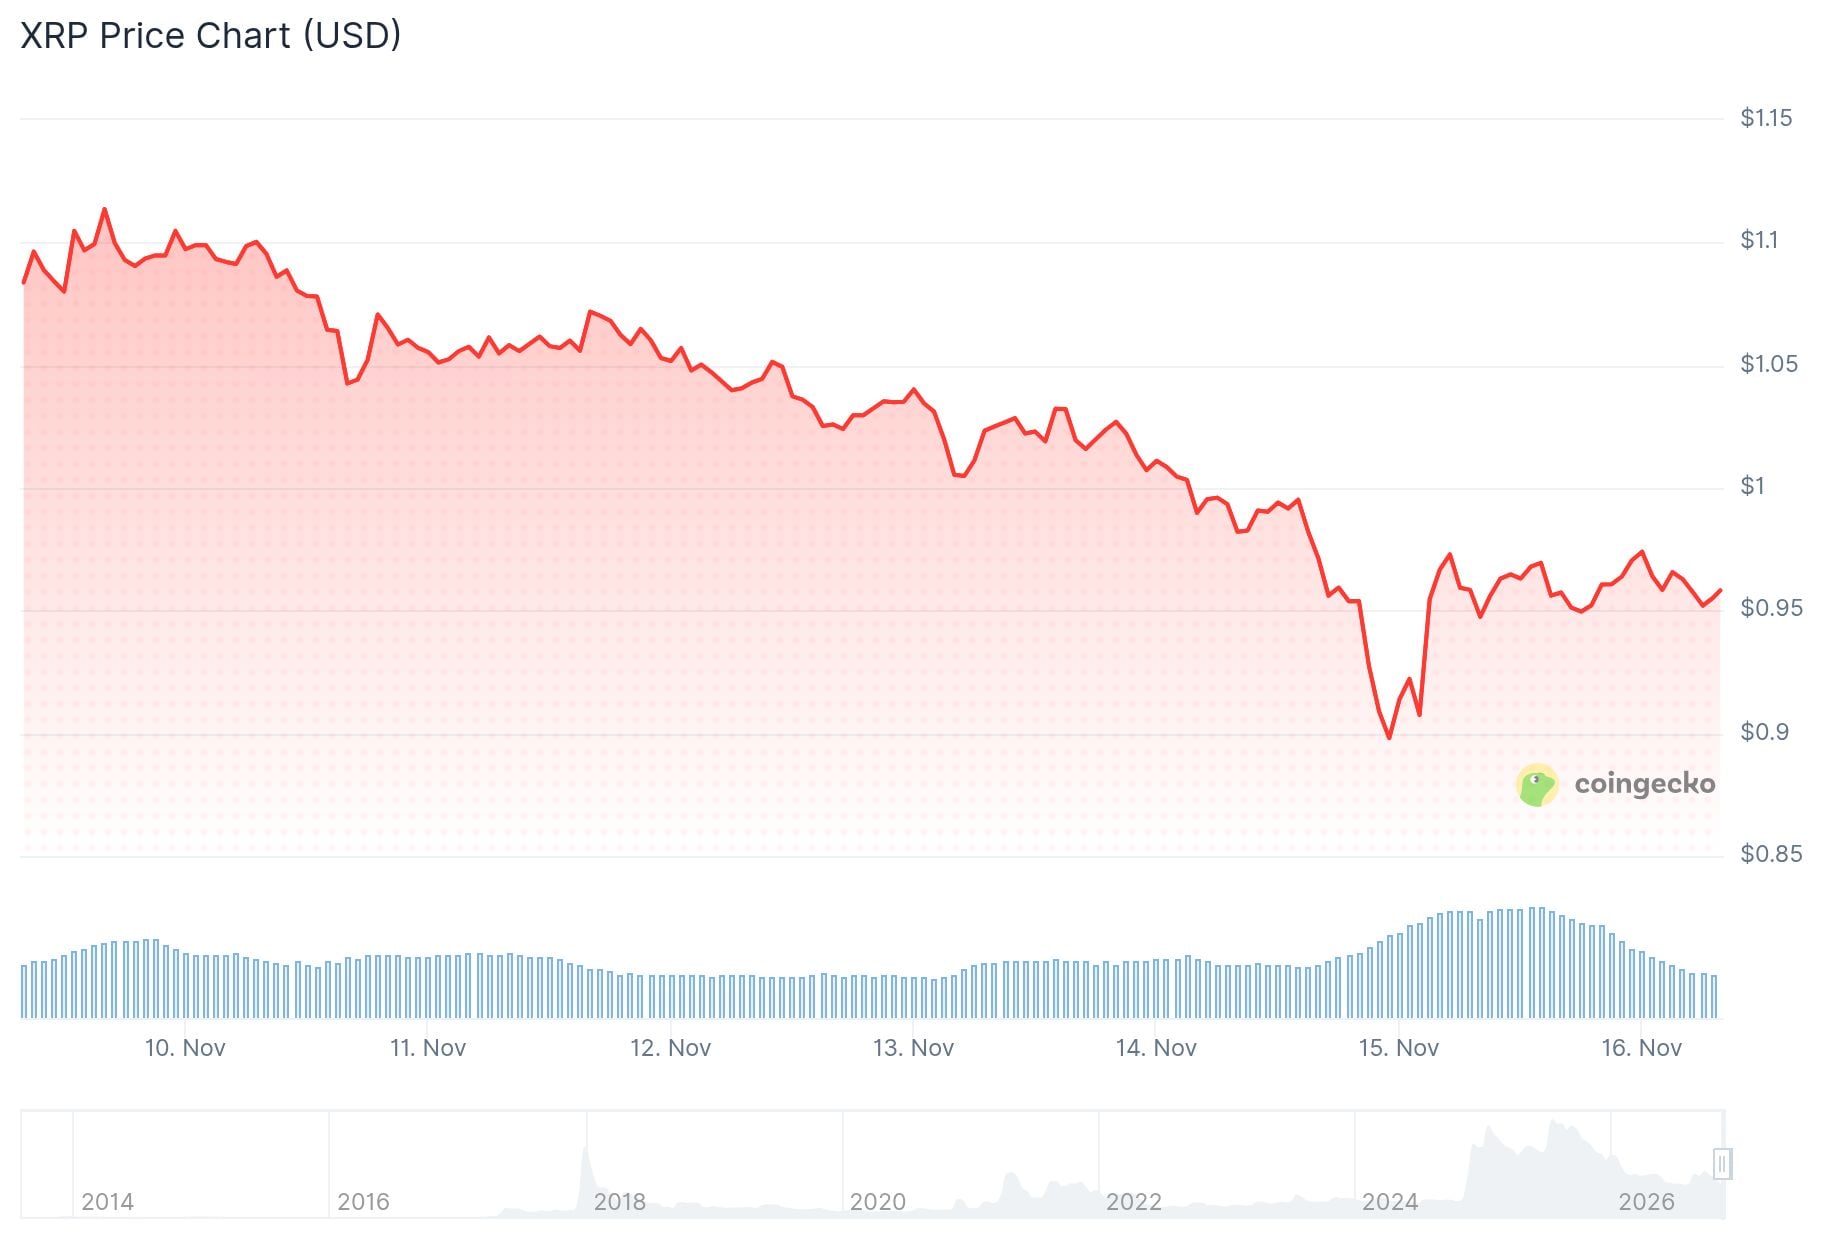
The price is now about 40% below its October highs near $1.60. The drop also pushed XRP under its August support level of $0.9852. That level had held prices up before the late-summer recovery.
Technical charts show XRP was rejected in the $1.55 to $1.65 zone in early October. Since then, the token has printed a steady run of lower highs and lower lows. The daily candle is still open, so the day’s closing structure is not yet confirmed.
Fund flow data points to softer demand from institutions. Alpha Finance reports that US spot XRP ETFs lost $10.4 million on November 9 and another $7.6 million on November 10. About $1.1 million left the funds on November 13.
Those three sessions add up to roughly $19.1 million in withdrawals. Even so, the funds have taken in about $1.71 billion since launching in November 2025. Bitwise’s fund is the largest contributor, with around $670 million in cumulative inflows.
Franklin Templeton Filing Shows Large XRP Holdings
A new SEC filing shows how much XRP one big issuer holds. Franklin Templeton’s spot XRP ETF held about 293.1 million tokens at the end of September. Those tokens were worth $439.7 million at the time.
The fund grew its position by roughly 30% in the third quarter. It started July with about 225.4 million tokens. The filing covers September, so it does not show any purchases made in November.

The fund’s reported cost basis was $501.4 million. That is about $61.8 million above the September value of the holdings. Ripple CEO Brad Garlinghouse also repeated this month that the company remains committed to XRP.
Ripple continues to work on institutional payments, stablecoin tools and tokenization services. Those projects have not stopped the price from sliding. XRP remains well below its recent peak.
On-chain data from the XRP Ledger shows steady use. DefiLlama’s November 16 figures put activity at about 3.64 million transactions and 64,437 active addresses over 24 hours. Decentralized exchange volume reached $16.34 million, and DeFi total value locked sat near $30 million.
Seven-day DEX volume rose about 67%. Stablecoin market capitalization on the ledger fell 12.3% over the same period, to roughly $851 million. That leaves trading volume rising while stablecoin supply shrinks.
Key Price Levels and Indicators for XRP
Analyst ChartNerd pointed to a rare chart signal on X. The analyst said XRP has swept below its 2-month upper regression band only five times in history. According to the post, each earlier sweep that followed a cycle peak came before a period of accumulation and then expansion.
$XRP has only swept below its 2-month upper regression band 5 times in history. Every sweep below following prior cycle peaks preceded accumulation that eventually follows into expansion. https://t.co/HcyOHAHTF8 pic.twitter.com/rKL6nWoWtz
— 🇬🇧 ChartNerd 📊 (@ChartNerdTA) November 15, 2026
The nearest support sits between $0.90 and $0.95. A hold there could allow a bounce toward $0.9852 and then $1. Resistance then stacks up at $1.05 to $1.10, followed by $1.18 to $1.25.
A daily close below $0.90 would put the $0.80 to $0.85 zone in view. Below that, the $0.70 to $0.75 area is the next level on the chart. Neither is a confirmed target.
The Relative Strength Index stands at 26.37, which is in oversold territory. It was near 21.5 on November 13, so it has recovered slightly. It is still far below the neutral level of 50.
The MACD line remains under its signal line and below zero. The histogram reads about -0.0183. A bullish crossover and an RSI move above 40 would point to better momentum.
For now, traders are watching whether XRP can hold $0.90 to $0.95 and whether ETF flows turn positive again.


