






TLDR
- Bitcoin is trading near $77,930 on Nov. 1, about 38% below its October 2025 record above $126,000.
- U.S. spot Bitcoin ETFs saw $643.2 million in net outflows on Oct. 30.
- The Fed held rates at 3.75%-4.00%, and Dallas Fed President Lorie Logan said at least two more hikes may be needed.
- The $75,000-$78,000 zone is the key support area, with resistance at $80,000-$85,000.
- Standard Chartered targets $100,000 by year-end, while Bernstein sees about $125,000.
Bitcoin (BTC) is trading near $77,930 on Nov. 1 after a rough end to October pushed the price back below $80,000.
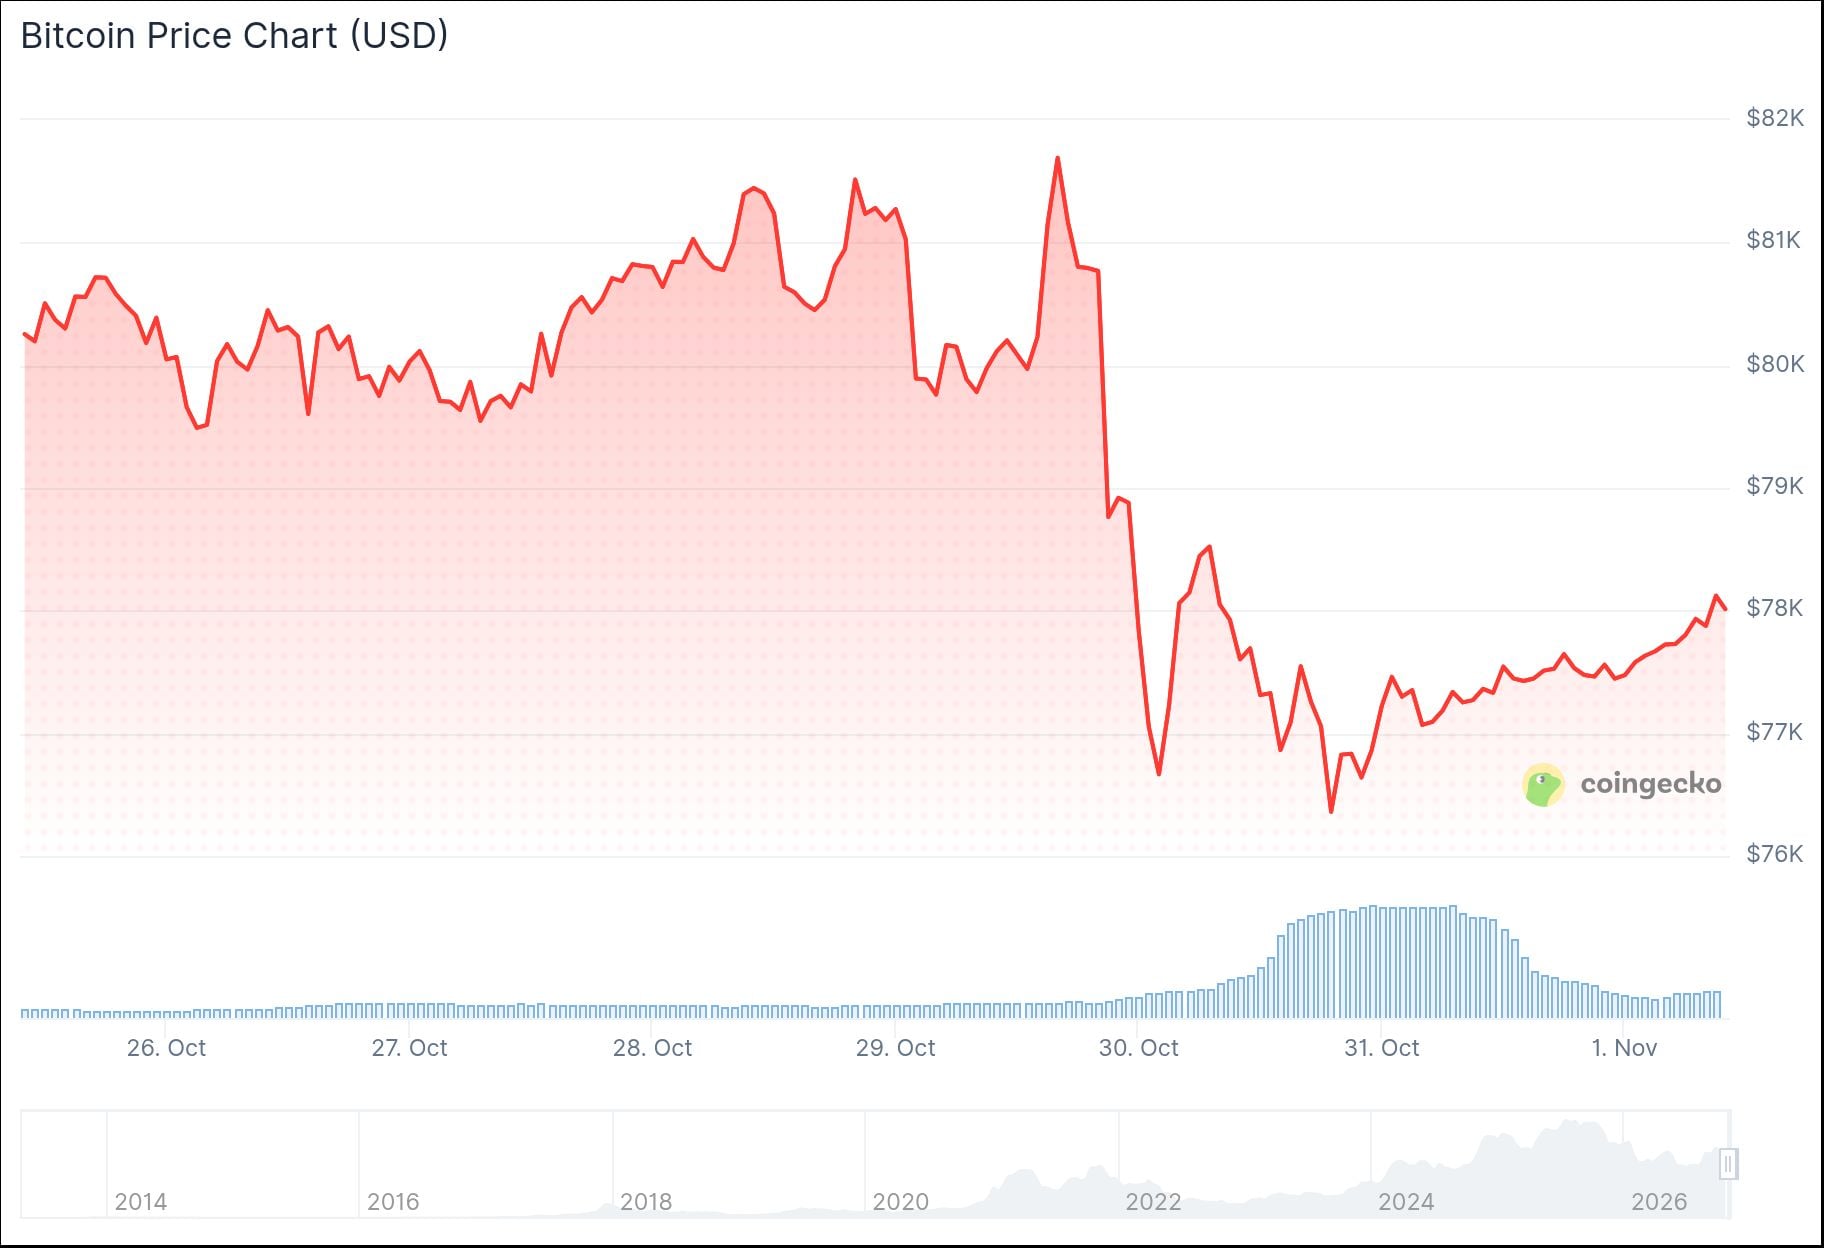
BTC is about 38% below its October 2025 record above $126,000.
The Federal Reserve held rates at 3.75%-4.00% on Oct. 28. Officials kept further tightening on the table as inflation stays above target.
Dallas Fed President Lorie Logan said on Oct. 30 that at least two more rate increases may be needed. That has added pressure to expectations for a December hike.
ETF Outflows and On-Chain Data Shape the Key Levels
U.S. spot Bitcoin ETFs saw $643.2 million in net outflows on Oct. 30. BlackRock’s IBIT lost $233.7 million, and Fidelity’s FBTC lost $201 million.
That followed inflows of $17.2 million on Oct. 29 and $137.3 million on Oct. 28. Cumulative ETF inflows remain near $57 billion.
Glassnode reports that each Bitcoin decline since August has produced smaller realized losses. That suggests fewer holders are selling in panic as price falls.

Glassnode also found large supply held by investors who bought above $85,000. Exchange order-book demand has shifted toward $78,000-$79,000.
Analyst Crypto Patel named $74,914 as the key higher-time-frame level. He said a higher-time-frame candle close below it could send BTC toward $65,500-$62,500, a zone he sees as a good long-term accumulation area.
$BTC: $74,914 is the key HTF inducement.
If we get a HTF candle close below this level, I expect #BTC to move toward $65,500–$62,500.
IMO, this could be the best zone to accumulate for the long term, potentially forming a major higher low before the next rally toward a new… pic.twitter.com/nenkHnVYIi
— Crypto Patel (@CryptoPatel) November 1, 2026
The daily RSI is 38.14, close to oversold. MACD sits below its signal line and below zero.
Analyst Ted Pillows said BTC tapped its 100-day moving average while the RSI approaches oversold territory. He wrote that the bottom looks close.
$BTC tapped its 100D MA level, while the RSI is approaching oversold territory.
Looks like the bottom is close. pic.twitter.com/NSUWkeEjdz
— Ted (@TedPillows) October 31, 2026
First support sits at $75,000-$77,000, with the rising trendline in the low $70,000s. If those levels fail, the next demand zone is $64,000-$67,000.
Year-End Forecasts for Bitcoin
Standard Chartered still forecasts $100,000 by the end of 2026. Bernstein sees about $125,000 by year-end and $150,000 around mid-2027.
From $77,930, BTC would need to rise about 28% to reach $100,000 and about 60% to reach $125,000.
Bulls first need to reclaim $80,000-$82,000, followed by resistance at $82,000-$83,000. Glassnode identified heavier resistance at $84,000-$85,000.
A daily close below $75,000 would expose the rising trendline near $72,000 and the $64,000-$67,000 support region.
BTC opened Nov. 1 near $77,424, reached $78,126 and dipped to $77,370 before recovering.


