





Bitcoin mining has grown from a hobby run on home computers into one of the world’s largest computing industries.
Today it runs on specialized hardware, consumes electricity at the scale of a mid-sized country, and produces tens of millions of dollars in daily revenue for the miners who secure the blockchain.
As of October 2026, the Bitcoin network was operating close to one zettahash per second. At the same time, the industry faces pressure from falling block subsidies, competition from artificial intelligence data centers and the constant search for cheaper electricity.
This article covers the most important Bitcoin mining statistics available, drawing on data from Cambridge Centre for Alternative Finance, Hashrate Index, mempool.space, Glassnode and others.
Key Numbers at a Glance
The following figures reflect conditions as of October 2026.
- Estimated seven-day hashrate: ~983 EH/s (roughly 0.98 zettahashes per second)
- Mining difficulty: ~132.72 trillion
- All-time hashrate peak: ~1,110 EH/s (November 2025)
- Top mining country: United States (~35.6% of estimated global hashrate)
- Current block subsidy: 3.125 BTC per block
- New BTC created daily: ~450 BTC
- Daily miner revenue: roughly $30 million–$45 million
- Transaction fees as share of revenue: ~0.69%
- Annual electricity consumption: ~138 TWh
- Share of global electricity: ~0.54%
- Share of power from sustainable sources: 52.4%
Bitcoin Network Hashrate
Hashrate measures the total computing power directed at the Bitcoin network. It is expressed in exahashes per second (EH/s), where one exahash equals one quintillion individual hashing operations.

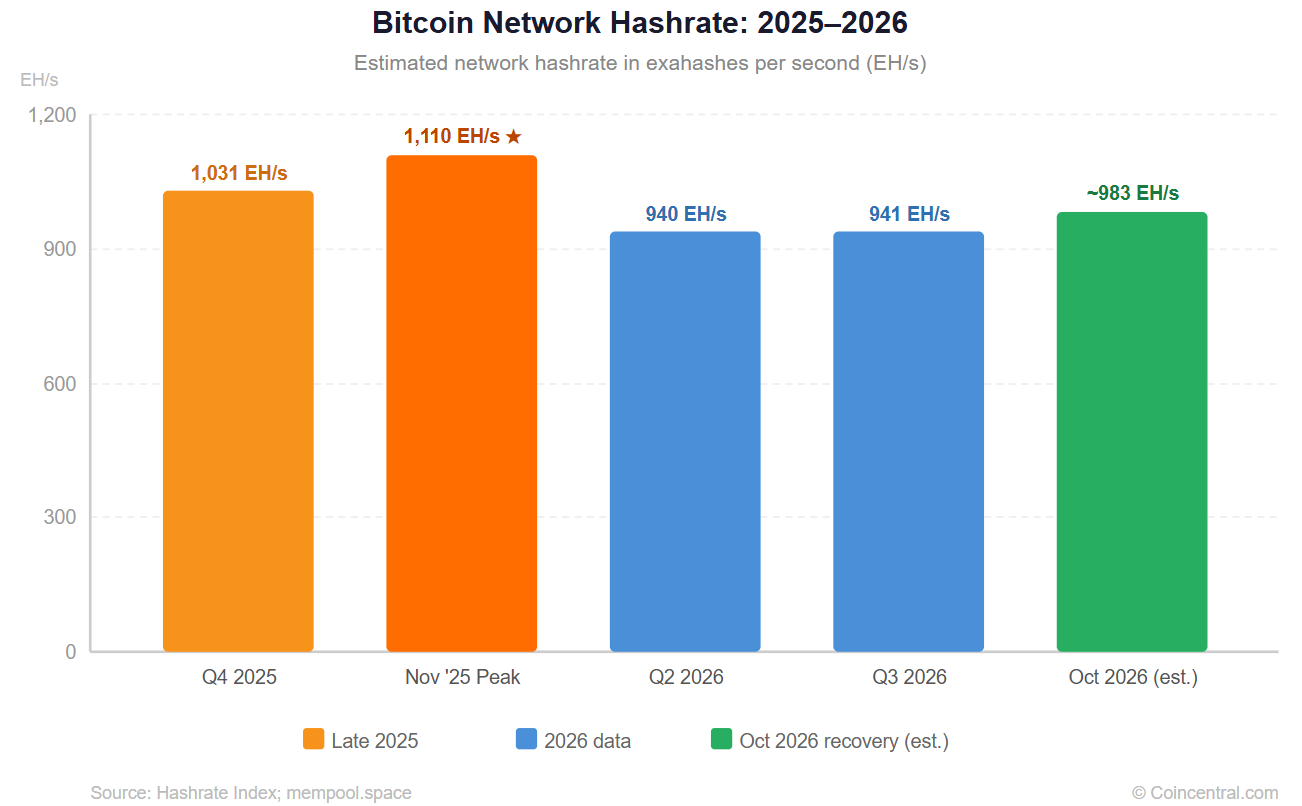
As of early October 2026, Bitcoin’s seven-day estimated hashrate stood at approximately 983 EH/s. That puts the network close to the one-zettahash-per-second threshold—meaning miners collectively perform close to one sextillion cryptographic calculations every second.
Bitcoin crossed the one-zettahash level during 2025. Hashrate Index estimates that the network peaked at approximately 1,110 EH/s in November 2025, the highest level ever recorded.
Hashrate then fell through the first half of 2026. Weaker mining economics pushed older, less-efficient machines offline. Some mining companies also began moving electricity and data-center capacity toward artificial intelligence workloads.
The Q3 2026 figure was roughly 8.7% lower year over year and about 15% below the November 2025 peak. More recent short-term data points to a partial recovery, with the seven-day estimate moving back toward 983 EH/s in early October 2026.
| Period | Estimated Hashrate |
|---|---|
| Q4 2025 | ~1,031 EH/s |
| November 2025 (Peak) | ~1,110 EH/s |
| Q2 2026 | ~940 EH/s |
| Q3 2026 | ~941 EH/s |
| Early October 2026 | ~983 EH/s |
Source: Hashrate Index, mempool.space
Mining Difficulty
Bitcoin’s mining difficulty controls how hard it is to find a valid block. It adjusts automatically every 2,016 blocks—roughly every two weeks—to keep the average time between blocks close to ten minutes.
Mining difficulty stood at approximately 132.72 trillion on October 7, 2026. A year earlier it was around 150.84 trillion, meaning difficulty had fallen about 12% over the year.
The all-time high was approximately 155.97 trillion, set in October 2025.
When miners switch machines off and hashrate falls, difficulty can also fall. This improves the economics for miners that stay online and helps the network find its balance—a built-in self-correcting mechanism in Bitcoin’s design.
Where Is Bitcoin Mined?
The blockchain does not record the physical location of mining hardware. Researchers estimate mining geography using data from mining pools, equipment shipments, firmware signatures and IP addresses.
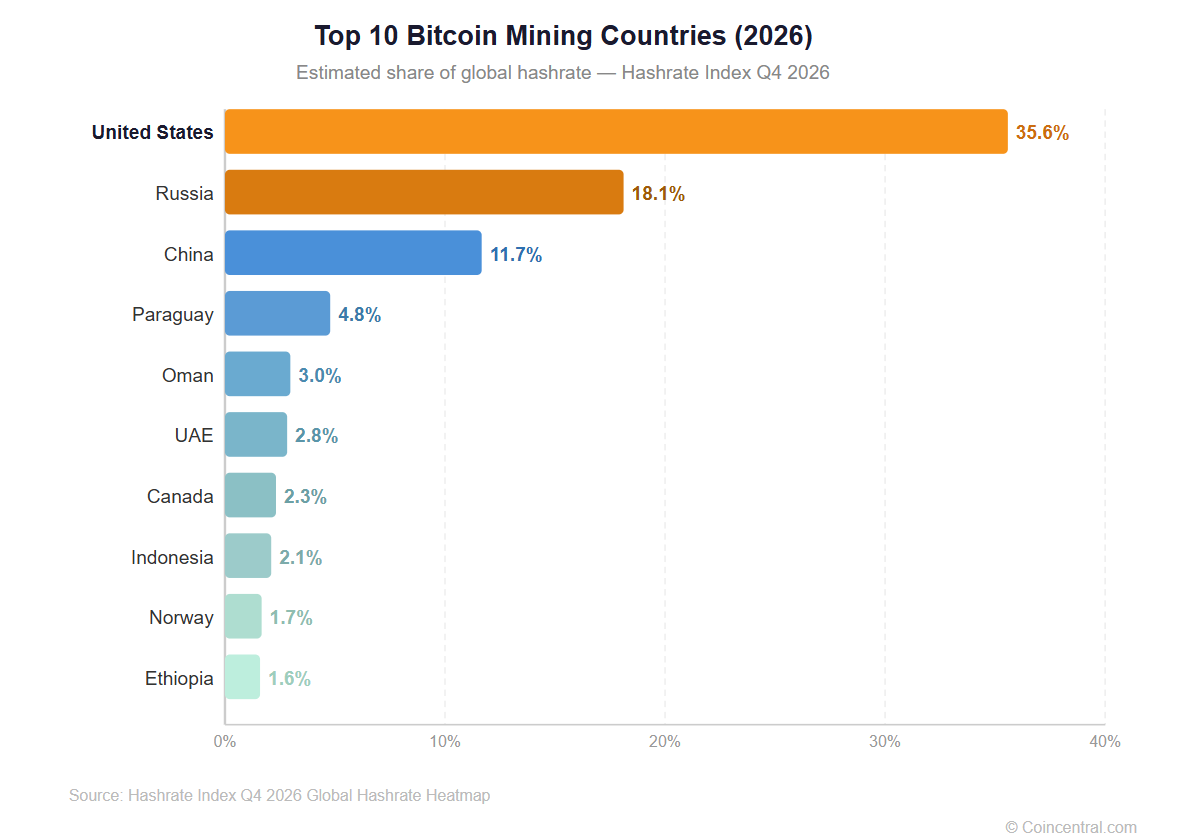
The figures below come from Hashrate Index’s Q4 2026 Global Hashrate Heatmap.
Top 10 Bitcoin Mining Countries (2026)
| Rank | Country | Estimated Share | Estimated Hashrate |
|---|---|---|---|
| 1 | United States | 35.6% | ~335 EH/s |
| 2 | Russia | 18.1% | ~170 EH/s |
| 3 | China | 11.7% | ~110 EH/s |
| 4 | Paraguay | 4.8% | ~45 EH/s |
| 5 | Oman | 3.0% | ~28 EH/s |
| 6 | UAE | 2.8% | ~26 EH/s |
| 7 | Canada | 2.3% | ~22 EH/s |
| 8 | Indonesia | 2.1% | ~20 EH/s |
| 9 | Norway | 1.7% | ~16 EH/s |
| 10 | Ethiopia | 1.6% | ~15 EH/s |
Source: Hashrate Index Q4 2026 Global Hashrate Heatmap
The United States, Russia and China together account for an estimated 65.4% of global Bitcoin hashrate.
The U.S. remains the world’s largest mining market by a wide margin. However, its estimated hashrate fell from roughly 389 EH/s a year ago to around 335 EH/s—a decline of about 14%. Hashrate Index links part of this drop to mining companies reallocating power capacity toward AI data centers.
Russia moved in the opposite direction. Its estimated share rose to approximately 18.1%, the highest level recorded in Hashrate Index’s data series.
China’s continued presence is worth examining. Despite a government crackdown on cryptocurrency mining that began in 2021, Hashrate Index still estimates around 110 EH/s of computing power operating in China, placing it third globally.
Paraguay has become the world’s fourth-largest estimated mining jurisdiction with approximately 45 EH/s. The country benefits from large surpluses of hydroelectric power, which provides inexpensive electricity that attracts mining operations.
Indonesia reached approximately 20 EH/s. Pakistan and Venezuela have also emerged as fast-growing locations, reflecting a broader pattern of mining spreading into countries with low-cost or surplus electricity.
Bitcoin Mining Pools
Mining pools combine computing power from many participants. The pool earns block rewards as a group and splits them proportionally based on each participant’s contributed work. This gives individual miners a steadier income stream than the lottery-like odds of solo mining.
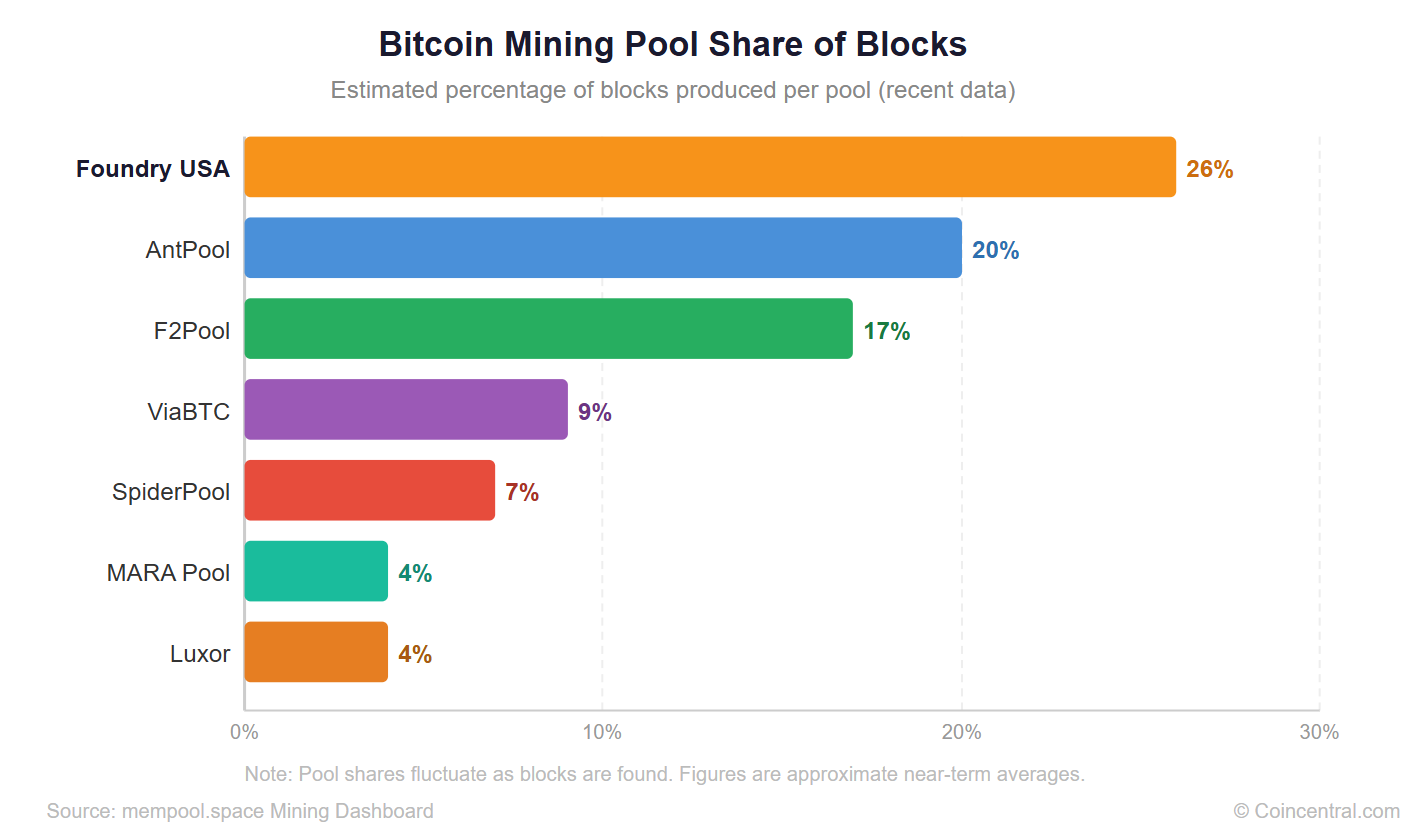
Recent mempool.space data shows block production concentrated among a small number of large pools.
| Pool | Estimated Share of Blocks |
|---|---|
| Foundry USA | ~26% |
| AntPool | ~20% |
| F2Pool | ~17% |
| ViaBTC | ~9% |
| SpiderPool | ~7% |
| MARA Pool | ~4% |
| Luxor | ~4% |
Source: mempool.space
Foundry USA, AntPool and F2Pool alone recently accounted for more than 60% of blocks. Looking at the full period since the April 2024 halving, Foundry USA has produced approximately 29.4% of all blocks, followed by AntPool at 19.8%, ViaBTC at 11.9% and F2Pool at 10.9%.
Pool concentration is not the same as hardware ownership concentration. Mining companies can move machines between pools quickly. A pool controlling 20% of hashrate does not necessarily own 20% of the mining equipment.
Large publicly traded miners are a growing part of the industry. MARA, for example, reported an energized hashrate of 66.4 EH/s at the end of 2025, up from 24.7 EH/s two years earlier. Other publicly traded miners including CleanSpark, Riot Platforms, IREN and Bitfarms also operate industrial-scale facilities.
How Much Energy Does Bitcoin Mining Use?
Measuring Bitcoin mining’s electricity consumption requires estimates rather than direct readings. There is no global meter on the network. Researchers rely on assumptions about hashrate, hardware efficiency and the geographic mix of mining operations.
Cambridge Centre for Alternative Finance ran one of the most detailed studies available. They surveyed 49 mining companies across 23 countries, covering approximately 48% of global Bitcoin hashrate at the time of the research.
Cambridge’s estimate for annual Bitcoin mining electricity consumption:
138 terawatt-hours per year.
That works out to roughly 0.54% of global electricity consumption—comparable to the annual electricity use of a mid-sized country.
Cambridge found hardware efficiency improved approximately 24% year over year, reaching around 28.2 joules per terahash as of June 2024.
Better hardware does not automatically mean lower total electricity use. More efficient machines can motivate miners to deploy additional units, and the industry’s overall hashrate can grow faster than efficiency improves. Total consumption can still rise even as individual machines use less power per terahash.
What Powers Bitcoin Mining?
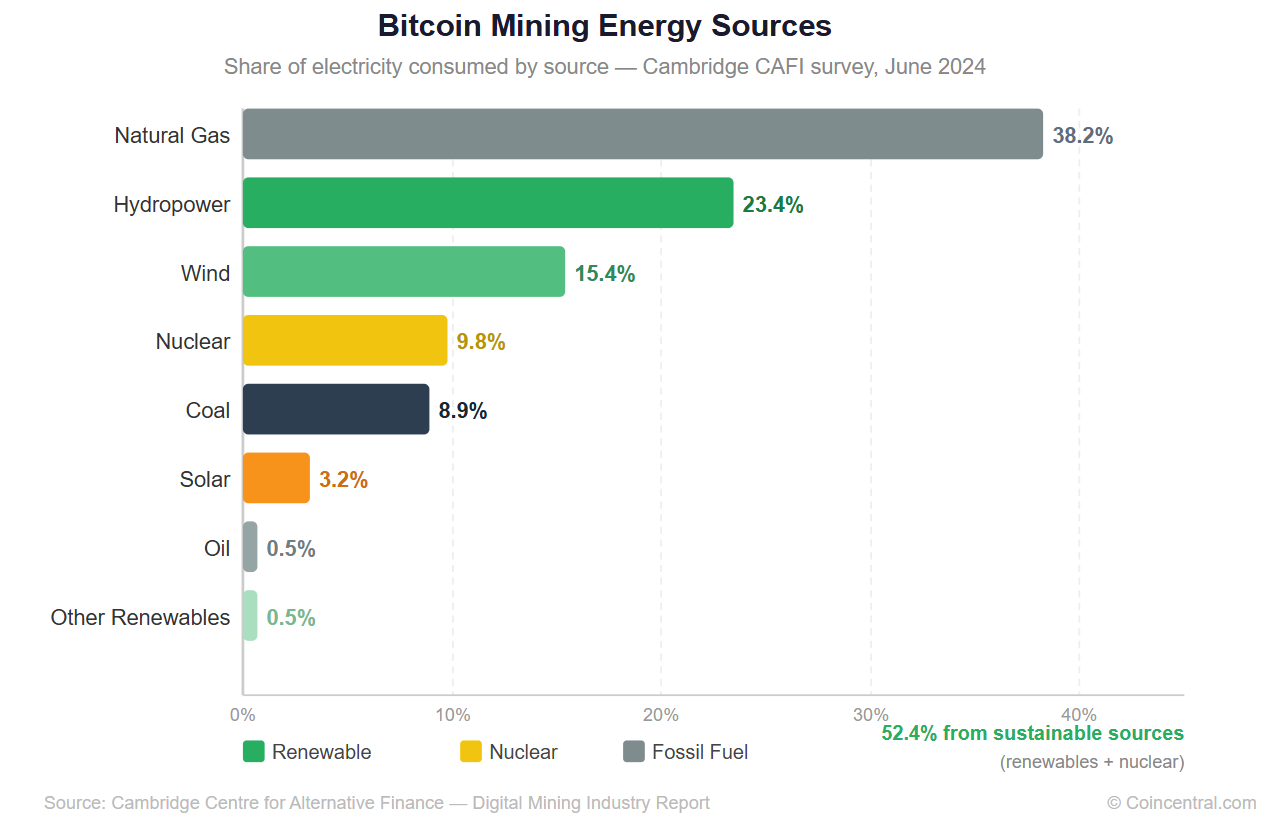
Cambridge’s survey found that more than half of Bitcoin’s electricity came from what it classifies as sustainable sources.
Approximately 52.4% of power reported by surveyed miners came from renewables and nuclear combined. Renewables alone accounted for 42.6%, with nuclear adding another 9.8%.
Bitcoin Mining Energy Sources
| Energy Source | Share |
|---|---|
| Natural gas | 38.2% |
| Hydropower | 23.4% |
| Wind | 15.4% |
| Nuclear | 9.8% |
| Coal | 8.9% |
| Solar | 3.2% |
| Oil | 0.5% |
| Other renewables | 0.5% |
Source: Cambridge Centre for Alternative Finance
Natural gas was the single largest source at 38.2%. Coal’s share dropped sharply, falling from around 36.6% in Cambridge’s 2022 survey to just 8.9% in the most recent data.
These figures cover only the miners that participated in the survey, and that group skewed heavily toward North American operations. Mining activity in Russia and China, where coal and natural gas are more common energy sources, is harder to measure and may not be fully represented in these percentages.
Bitcoin Mining’s Carbon Footprint
Cambridge estimated annual greenhouse-gas emissions from Bitcoin mining at approximately 39.8 million tonnes of CO2 equivalent per year. That represents roughly 0.08% of global greenhouse-gas emissions.
The figure is sensitive to the assumptions used. Carbon intensity varies widely by country, and factors such as the use of otherwise-flared natural gas can shift the result.
Cambridge’s figure is best treated as a useful baseline rather than a precise count of every mining operation worldwide.
How Much Do Miners Earn?
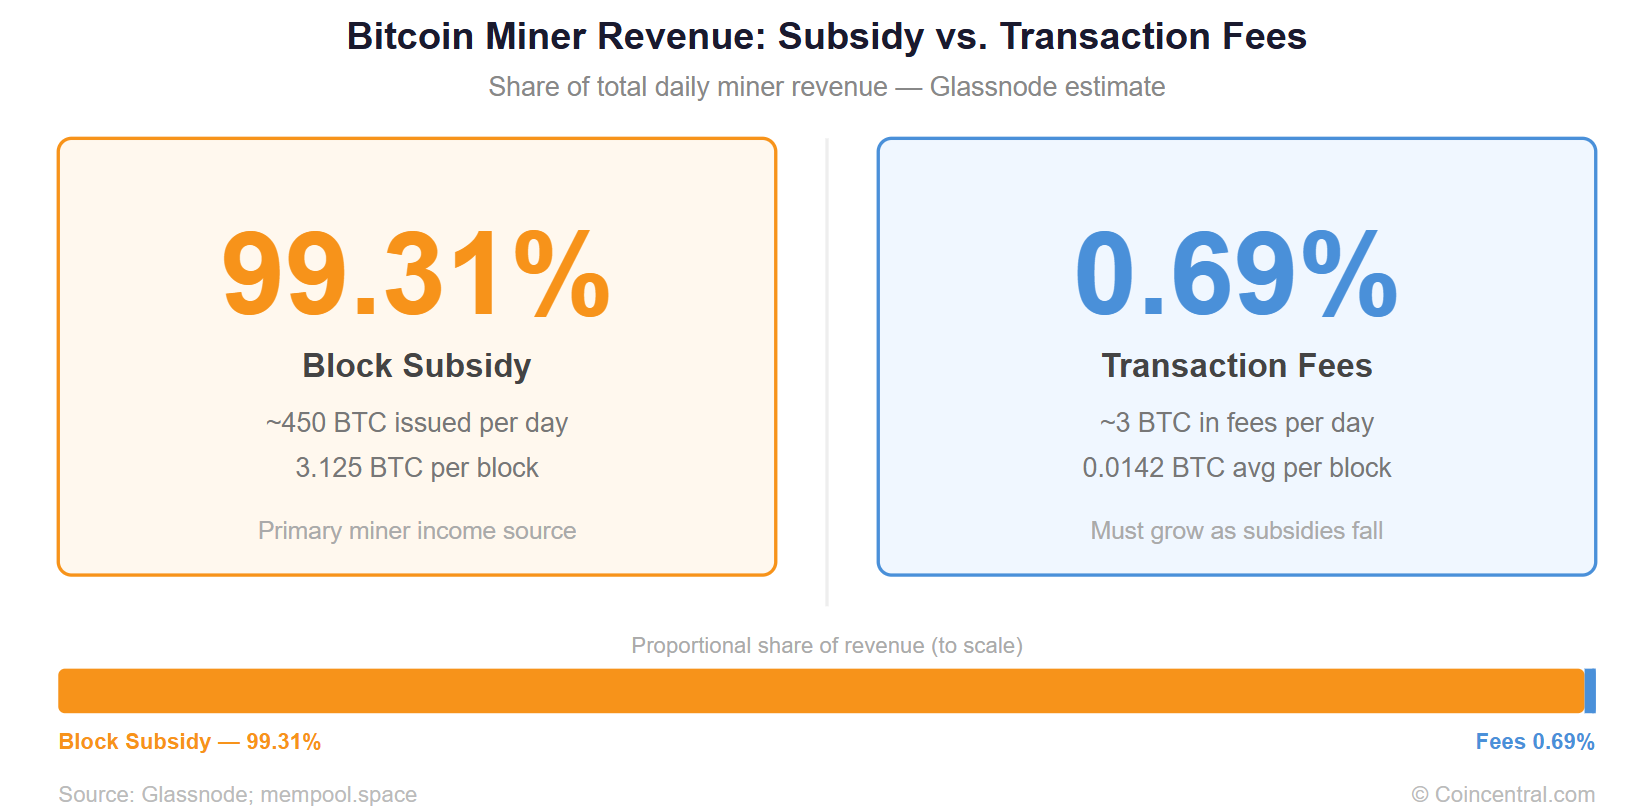
Bitcoin miners earn income from two sources: the block subsidy and transaction fees. The block subsidy is by far the larger of the two.
The block subsidy currently stands at 3.125 BTC per block, following Bitcoin’s fourth halving in April 2024. With approximately 144 blocks produced per day, that works out to roughly 450 new BTC issued daily.
Over a full year at the current subsidy level, approximately 164,000 BTC can be issued, assuming blocks arrive at the target interval.
In dollar terms, miner revenue tracks Bitcoin’s price closely. Glassnode data shows daily aggregate miner revenue generally ranged from $30 million to $35 million in recent months. Blockchain.com data recorded individual 2026 days above $40 million.
YCharts placed miner revenue at approximately $44.04 million on September 11, 2026, versus $55.43 million on the same date one year earlier. The year-over-year decline reflects a combination of a lower Bitcoin price and the reduced block subsidy introduced at the April 2024 halving.
Transaction Fees: A Growing Concern
Transaction fees are the second component of miner income. Users attach fees to transactions and miners generally prioritize those offering the highest fee rate. When demand for Bitcoin block space rises, fees rise with it.
Ordinals, BRC-20 tokens and the Runes protocol each produced short-term spikes in fee revenue during previous periods of high demand. Current conditions are very different.
Mempool.space’s recent 144-block data showed:
- Total miner rewards: approximately 452 BTC
- Average transaction fees per block: approximately 0.0142 BTC
- Average subsidy per block: 3.125 BTC
During the period measured, miners collected roughly 2 BTC in total fees across 144 blocks, compared with approximately 450 BTC in new block subsidies.
Glassnode estimated fees at around 0.69% of total miner revenue.
This matters for Bitcoin’s future security model. The block subsidy halves roughly every four years. The next halving, expected around 2028, will cut the reward from 3.125 BTC to 1.5625 BTC per block. The halving after that will cut it further, and so on until the subsidy eventually reaches zero.
Bitcoin’s security model depends on miners having enough economic incentive to keep processing transactions and securing the blockchain. If the subsidy disappears and fees do not grow large enough to replace it, miner revenue falls—and with it, the economic security of the network.
At less than 1% of revenue today, fees have a long way to go.
What Does Mining Cost?
Cambridge found that electricity accounted for more than 80% of miners’ cash operating expenses.
Surveyed mining companies reported a median electricity-only cost of $45 per MWh and a median all-in power cost of $55.50 per MWh.
Access to cheap electricity is one of the biggest competitive advantages in the mining industry. It explains why mining operations tend to appear near surplus hydropower, stranded natural gas, curtailed renewable energy or other sources of low-cost power.
Financing, hardware depreciation, cooling systems, data center space and staff make up the bulk of remaining costs. Hardware costs in particular are closely tied to the ASIC upgrade cycle. Miners must continuously invest in newer, more efficient machines to stay competitive as older hardware becomes unprofitable to run.
Hardware Efficiency
Modern Bitcoin mining depends almost entirely on ASICs—application-specific integrated circuits built solely to compute Bitcoin’s proof-of-work algorithm. General-purpose hardware such as GPUs and CPUs can no longer compete for Bitcoin mining profitably.
Cambridge estimated average industry hardware efficiency at approximately 28.2 joules per terahash as of June 2024, a 24% improvement from the previous year.
Large miners push further than the industry average. MARA reported fleet efficiency of approximately 18.6 J/TH at the end of 2025—well below the industry average.
Hardware manufacturing is concentrated in a small number of companies. Cambridge found the three largest ASIC makers controlled more than 99% of the market. Bitmain alone accounted for approximately 82% of surveyed hardware. MicroBT and Canaan make up most of the remainder.
Bitcoin Mining vs. AI
One of the biggest shifts in the mining industry over 2025 and 2026 has been competition from artificial intelligence data centers.
Bitcoin mining sites share many features with AI infrastructure: large electrical connections, established data center facilities, fiber connectivity and the capacity to handle very high electrical loads. Several publicly traded Bitcoin miners began allocating capital and power capacity toward AI and high-performance computing projects.
Hashrate Index says this trend contributed to declining Bitcoin mining capacity in the United States, Canada and the UAE during 2026.
This creates a structural change for the industry. In the past, miners could restart idle machines relatively quickly when Bitcoin prices rose and mining became more profitable. Power capacity committed to long-term AI infrastructure contracts may not return to Bitcoin mining even when mining conditions improve.
Whether this shift proves temporary or permanent will depend on how Bitcoin’s price trajectory compares with the economics of AI data center contracts over the years ahead.
What Comes Next?
Bitcoin mining is close to the one-zettahash-per-second level. The United States remains the top mining country. Industrial miners now measure capacity in gigawatts, not megawatts.
Yet the economics have changed dramatically. The block subsidy has fallen from 50 BTC at Bitcoin’s launch in 2009 to 3.125 BTC today. It will halve again around 2028 and continue falling roughly every four years.
The mining industry today relies almost entirely on newly issued Bitcoin to pay its bills. Transaction fees, at less than 1% of revenue, barely register.
For Bitcoin to remain as secure and well-funded in twenty years as it is today, its fee market will need to grow into a much larger share of total miner income. Whether that happens—and at what pace—is the most important number to watch as the block subsidy continues to shrink.
Sources
-
- Hashrate Index – Global Hashrate Heatmap, Q4 2026.
- mempool.space – Bitcoin Mining Dashboard.
- Cambridge Centre for Alternative Finance – Cambridge Digital Mining Industry Report.
- Cambridge Judge Business School – Sustainable Energy Rising in Bitcoin Mining.
- Cambridge Digital Mining Industry Report – Full PDF.
- Blockchain.com – Bitcoin Mining Charts.
- Glassnode – Bitcoin Miner Revenue.
- Glassnode – Miner Revenue From Fees.
- S&P Global – Can Bitcoin Mining Outlive Block Subsidies?
- MARA – 2025 Annual Report.


