






Bitcoin launched in January 2009 with no monetary value. Today it trades above $80,000. That journey covers 16 years, four halving events, multiple crashes of over 80%, and a shift from a niche tech experiment to an asset held by major institutions and retirement funds.
This article pulls together the key statistics from Bitcoin’s full price history. Each section covers a major era, with tables showing the data and charts you can download.
Bitcoin remains one of the most volatile assets in the world. Nothing in this article is investment advice. The goal is a clear, factual record of what the data shows.
The Genesis Years: 2009–2012
Bitcoin’s first recorded price was $0.00099 per coin. That transaction happened in October 2009, when a BitcoinTalk forum member called NewLibertyStandard set up an exchange. Another user named Sirius sent him 5,050 BTC in exchange for $5.02 via PayPal.
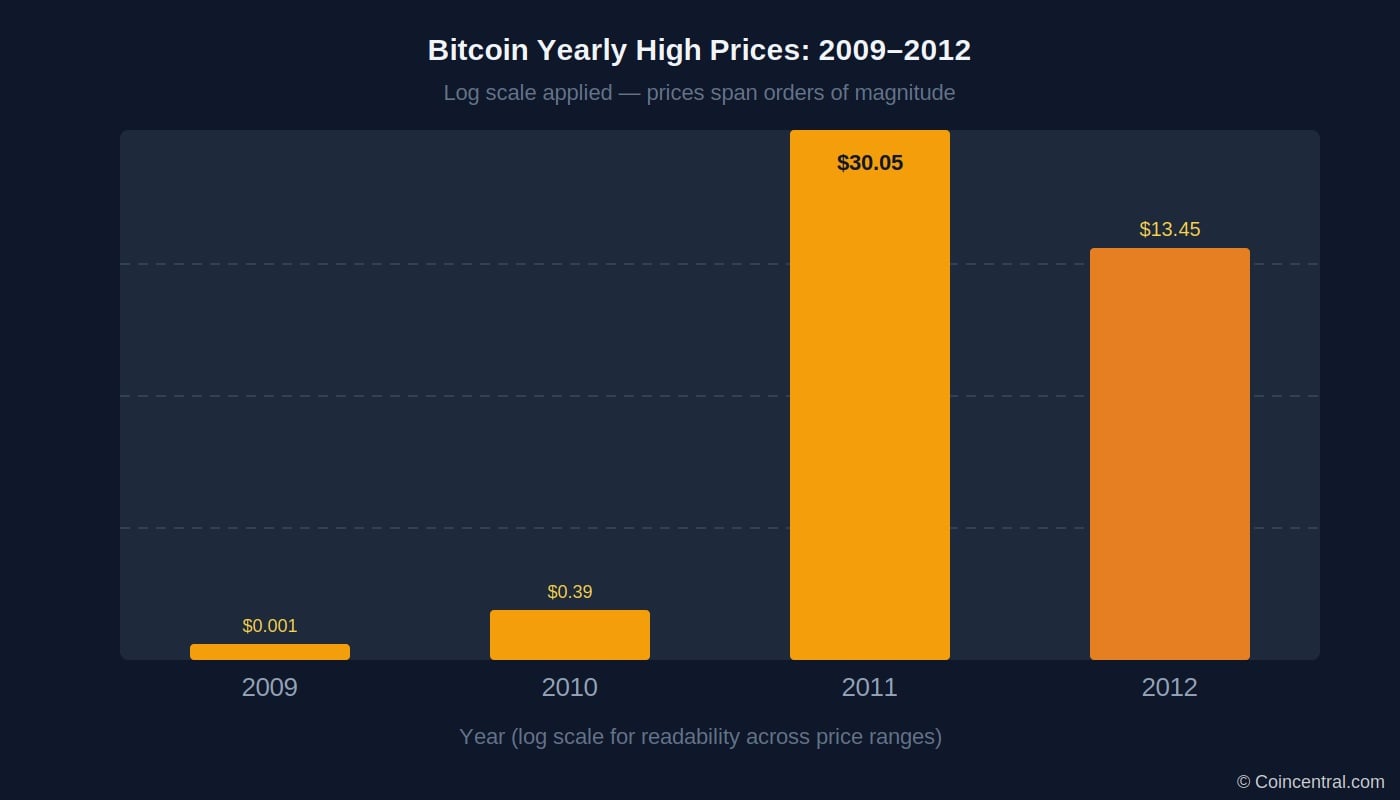
For most of 2010, Bitcoin traded below $0.10. Its highest recorded price that year was just $0.39. Mt. Gox opened as a Bitcoin exchange in July 2010 and quickly became the dominant trading venue.
The most famous event of 2010 was Bitcoin Pizza Day on May 22. A programmer named Laszlo Hanyecz paid 10,000 BTC for two pizzas worth about $41. Those same 10,000 BTC would later be worth over $1.2 billion at Bitcoin’s 2025 all-time high.
2011 brought the first real price surge. Bitcoin crossed $1 for the first time on February 9, 2011. By June it reached $30.05 on Mt. Gox. A hack of that exchange triggered a flash crash to near $0.01 in minutes. Bitcoin closed 2011 at around $4.00.

2012 was a quiet year. Bitcoin traded in a narrow range near $5 for most of it. In November 2012, the first halving cut the mining reward from 50 BTC to 25 BTC. The Bitcoin Foundation was also founded in 2012 by Gavin Andresen and others. The price reached a yearly high of $13.45 in December.
| Year / Event | Price | Notes |
|---|---|---|
| Oct 2009 – First recorded trade | $0.00099 | 5,050 BTC for $5.02 via PayPal |
| May 22, 2010 – Bitcoin Pizza Day | ~$0.004 | 10,000 BTC for two pizzas (~$41) |
| 2010 – Yearly high | $0.39 | Mt. Gox opens July 2010 |
| Feb 9, 2011 – First $1 | $1.00 | First parity with the US dollar |
| Jun 9, 2011 – Mt. Gox peak | $30.05 | Exchange hack caused immediate crash |
| 2011 year-end | ~$4.00 | Closed sharply below peak |
| Nov 2012 – First halving | ~$11 | Block reward: 50 BTC cut to 25 BTC |
| 2012 – Yearly high | $13.45 | Reached in December 2012 |
The First Major Bull Run: 2013
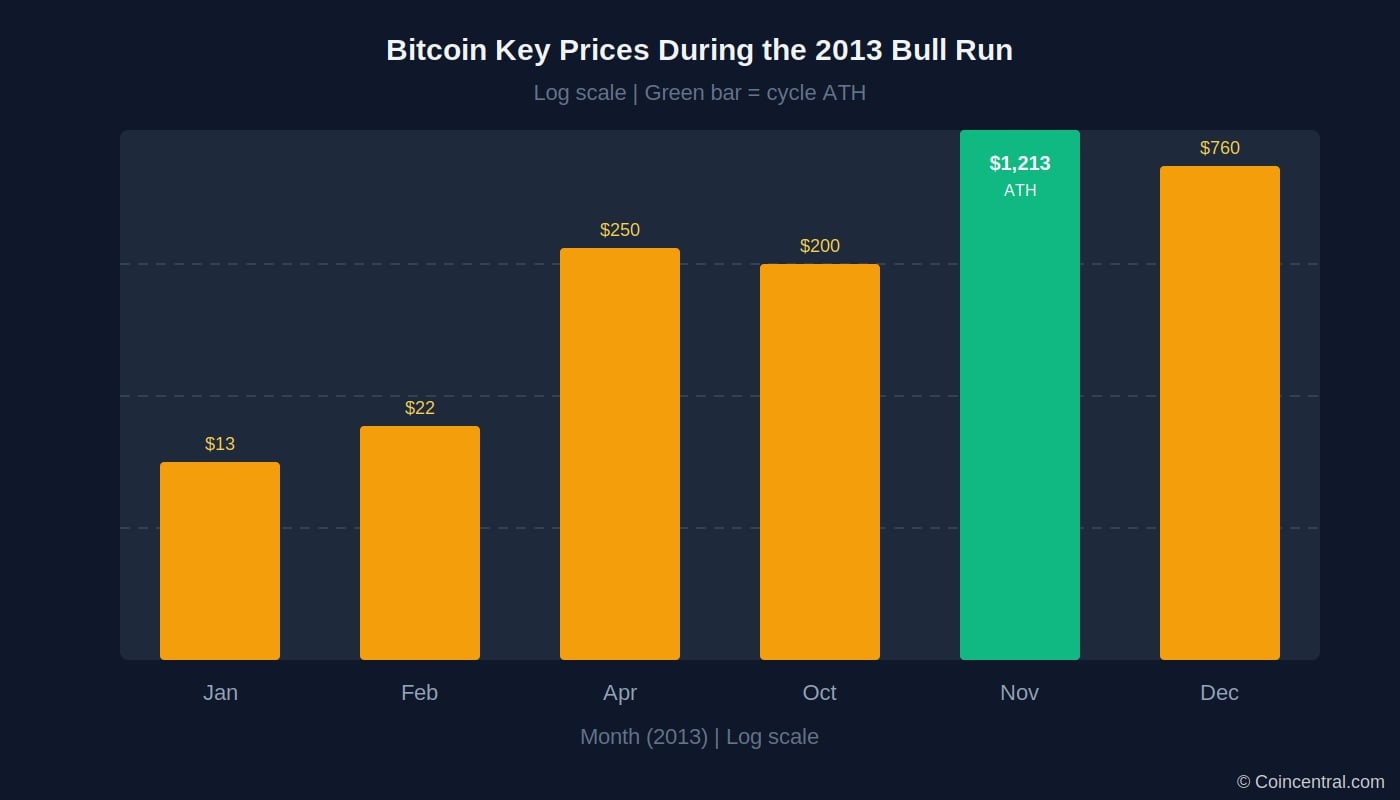
2013 was Bitcoin’s first year of global mainstream coverage. The price started at $13 in January. By April it had crossed $250, a gain of over 1,800% in three months.
The Cyprus banking crisis played a role. Cyprus’s government imposed capital controls in early 2013 and threatened to seize a portion of bank deposits. News coverage at the time explicitly connected the crisis to Bitcoin’s price surge, as some investors looked outside the traditional banking system.
Coinbase, founded less than a year before, reported selling $1 million worth of Bitcoin in February 2013 at an average price of $22. The world’s first Bitcoin ATM opened in Vancouver that year. Bitcoin’s market cap crossed $1 billion for the first time.
After cooling off from the April spike, Bitcoin launched another run in the final quarter. It crossed $1,000 for the first time in November 2013. Some data sources show a peak as high as $1,213.
The year ended at roughly $760. But regulators were watching. In December 2013, China’s People’s Bank prohibited financial institutions from transacting in Bitcoin. BTC China, then the world’s largest exchange, shut down. The price dropped sharply.
The Chinese ban was one of the first clear examples of how regulatory news could move Bitcoin’s price within hours. That pattern has repeated many times since.
| Month / Event | Price | Context |
|---|---|---|
| January 2013 | $13 | Year opens; market rebuilding after 2012 |
| February 2013 | $22 | Coinbase reports $1M in monthly BTC sales |
| April 2013 | $250 | First 2013 peak; Cyprus crisis coverage boosts interest |
| October 2013 | $200 | Second run begins after summer consolidation |
| November 2013 | $1,213 | All-time high at the time; market cap tops $1B |
| December 2013 | $760 | China bans financial institutions from using BTC |
The Mt. Gox Collapse and Bear Market: 2014–2016
The most damaging single event in Bitcoin’s early history happened in February 2014. Mt. Gox, then the world’s largest Bitcoin exchange, suspended all withdrawals. It then filed for bankruptcy and reported losing between 744,000 and 850,000 BTC of user funds.
Bitcoin’s price fell more than 55% between February and April 2014. The bear market that followed lasted into 2015. In January 2015, the price dropped 50% in the first two weeks alone, including a 24% drop on January 14.
Part of that January 2015 selloff was triggered by Bitstamp, a major European exchange, reporting the loss of 19,000 BTC in a hack. The local bottom that month was around $150. It was the last time Bitcoin ever traded at that level.
A slow rebuild began through 2015. The price crossed $500 again by late in the year. The New York Department of Financial Services began investigating Bitcoin, eventually creating the BitLicense regulatory framework. In November 2015, the Unicode Committee adopted the Bitcoin symbol (₿).
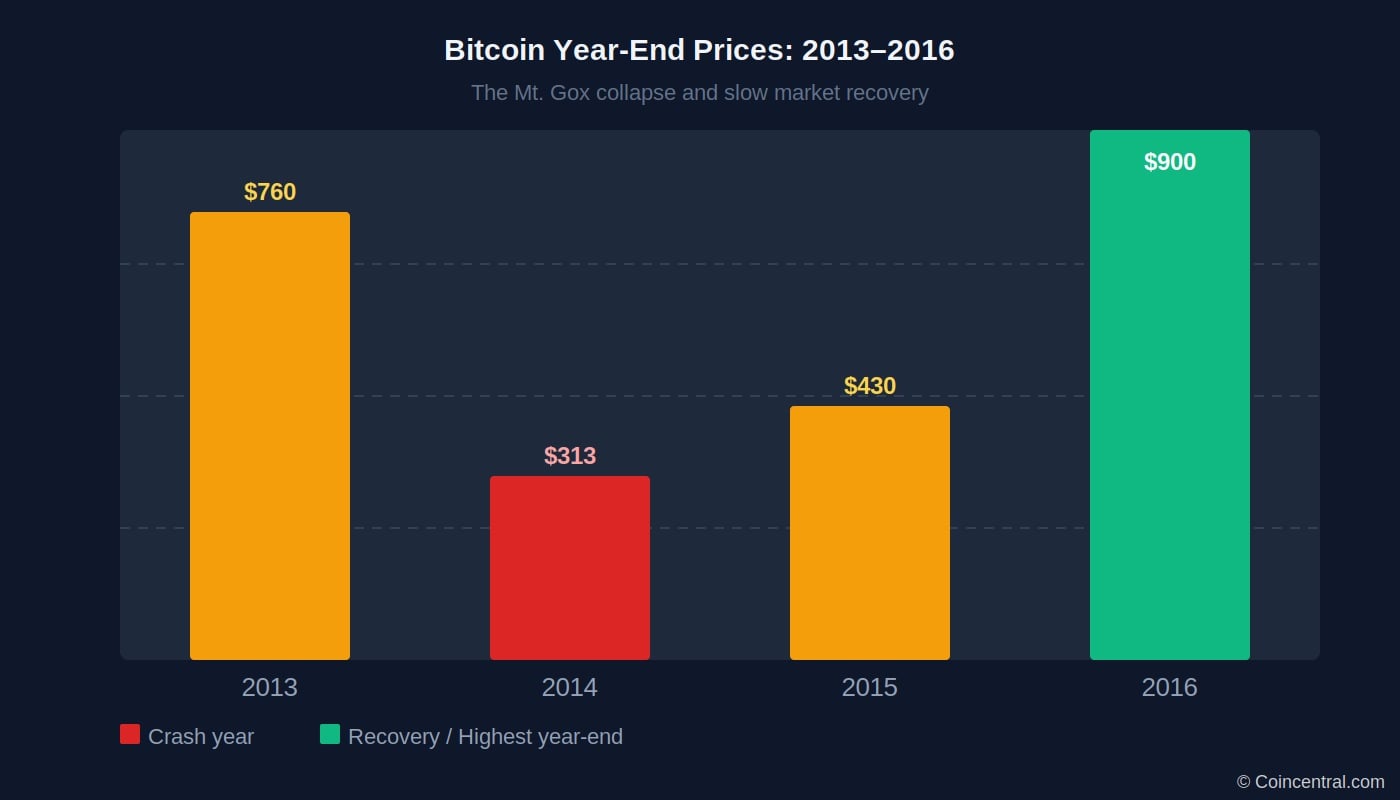
2016 was steady, quiet growth. Bitcoin’s network hash rate topped 1 exahash per second for the first time. The second halving in July 2016 cut the block reward from 25 BTC to 12.5 BTC. The price closed 2016 just below $1,000, setting up the move that came in 2017.
| Year | Year-End Price | Key Event | Change YoY |
|---|---|---|---|
| 2013 | $760 | Bull run peak year | +5,750% |
| 2014 | $313 | Mt. Gox collapse; prolonged bear market begins | -59% |
| 2015 | $430 | Local bottom at $150; gradual recovery | +37% |
| 2016 | $900 | 2nd halving (Jul); network hash rate ATH | +109% |
The 2017 Explosion
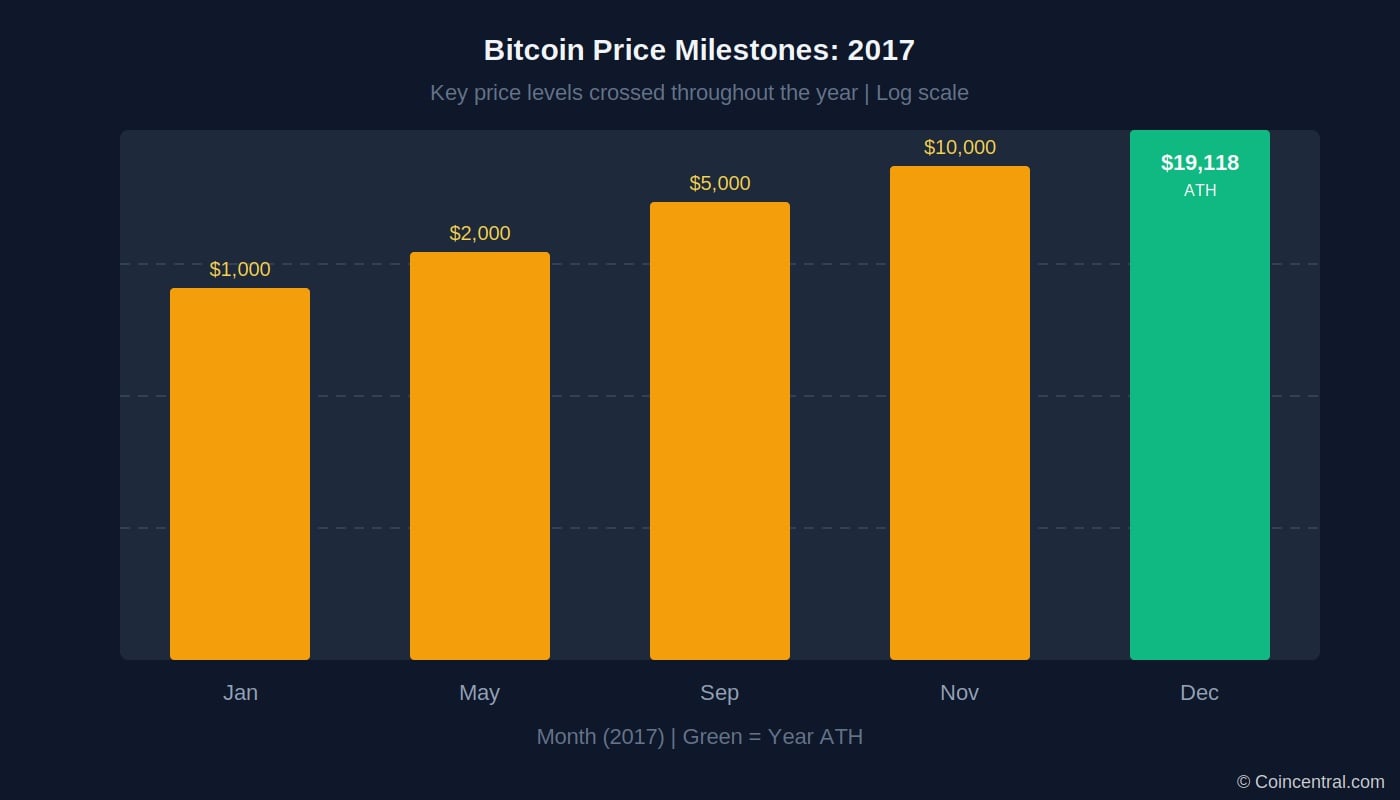
No year brought more mainstream attention to Bitcoin than 2017. The price started January at $1,000 and finished December at $19,118. That is a gain of roughly 1,300% in twelve months.
Bitcoin crossed $1,000 for the first time in three years on January 1, 2017. It broke $2,000 in May, $5,000 in September, and $10,000 in late November. Each new milestone brought fresh media coverage and new retail buyers into the market.
Part of the 2017 run was tied to the initial coin offering (ICO) boom. More than 800 new coins launched through ICOs in 2017, raising a combined $5.6 billion. Speculative energy from those launches also flowed into Bitcoin.
Trading volume grew across every major exchange. Mexico’s Bitso exchange grew volume by 1,500% in the six months ending March 2017. Poloniex saw a 600% increase in active traders over the full year.
On December 11, 2017, the Chicago Board Options Exchange launched Bitcoin futures trading. Bitcoin rose 12% that day. The price peaked seven days later at $19,118 on December 18. That level held as an all-time high for nearly three years.
The year also saw the Bitcoin Cash hard fork in August 2017. As of 2026, Bitcoin Cash’s market cap is less than 1% of Bitcoin’s, suggesting the fork did not weaken Bitcoin’s position.
| Date | Price | Event |
|---|---|---|
| Jan 1, 2017 | $1,000 | Year opens; breaks 3-year ATH barrier |
| May 2017 | $2,000 | First time above $2K |
| Aug 2017 | – | Bitcoin Cash hard fork |
| Sep 2017 | $5,000 | $5K milestone crossed |
| Nov 2017 | $10,000 | $10K crossed for first time |
| Dec 11, 2017 | +12% day | CBOE Bitcoin futures trading launches |
| Dec 18, 2017 | $19,118 | All-time high; held for nearly 3 years |
Crypto Winter: 2018–2019
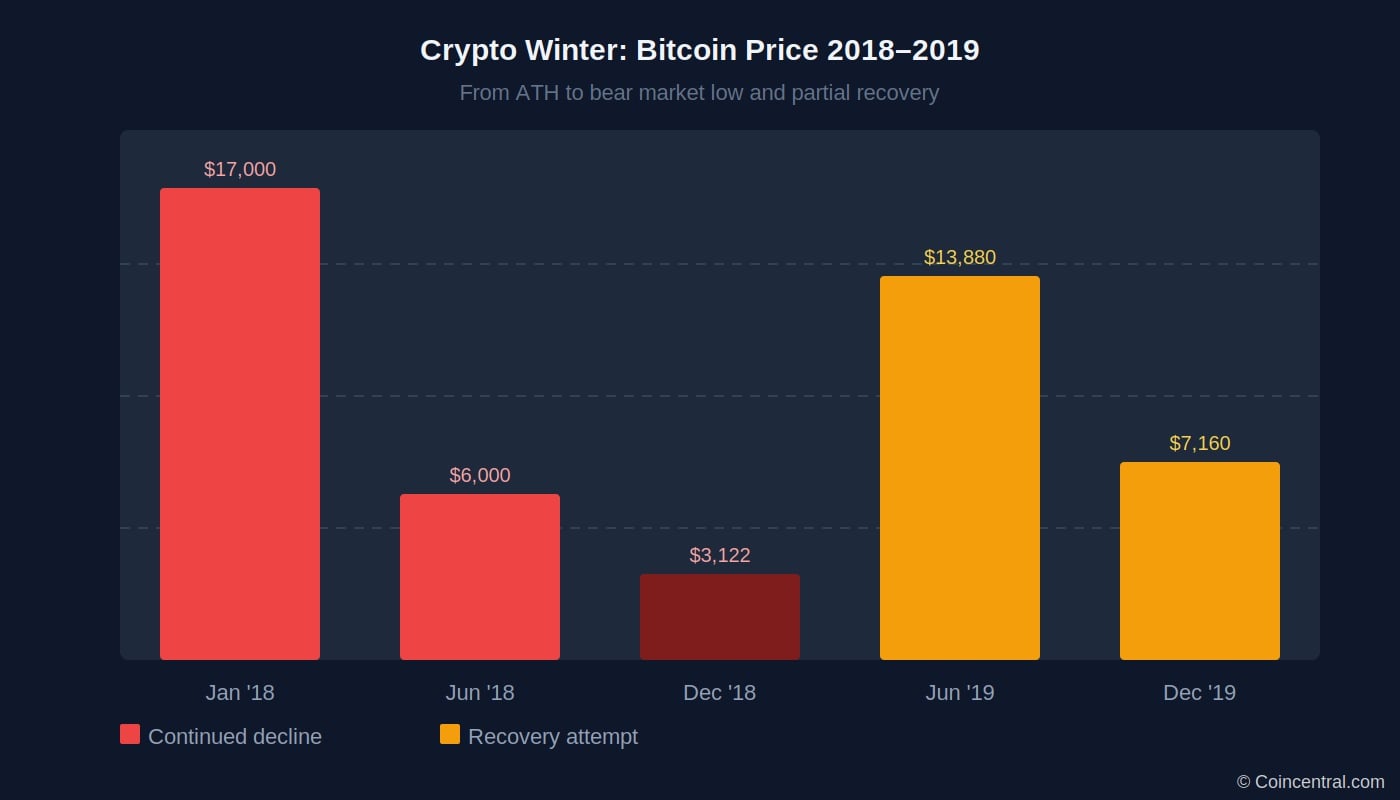
After the 2017 peak, Bitcoin entered what many in the industry now call the “crypto winter.” The price fell from $17,000 at the start of 2018 to $3,200 by December. That is a loss of about 81% in twelve months.
Google, Twitter, and Facebook all banned cryptocurrency advertisements during 2018. Bitcoin’s year-on-year return for 2018 was -73%. The year-end close was $3,693. The bear market low came on December 15, 2018, when the price hit $3,122.
Regulators shifted from vague warnings to direct enforcement after the 2017 ICO boom. The U.S. SEC announced settled charges against token issuers and highlighted registration failures. Parts of the industry began moving toward more compliant structures.
Development continued despite the low prices. The Lightning Network, a Layer 2 system for faster and cheaper Bitcoin payments, launched in March 2018. Institutional custody providers also began entering the space during this period.
2019 brought a partial recovery. Bitcoin climbed from below $4,000 in January to $13,880 by June. But those gains faded. It ended 2019 at around $7,160. The bounce from $3,500 to $13,500 and back showed the market was still active, even if the 2017 highs felt far away.
| Period | Price | Change from 2017 ATH |
|---|---|---|
| Dec 18, 2017 (ATH) | $19,118 | – |
| January 2018 | $17,000 | -11% |
| June 2018 | $6,000 | -69% |
| Dec 15, 2018 (bear low) | $3,122 | -84% |
| Dec 31, 2018 (year close) | $3,693 | -81% |
| June 2019 (recovery peak) | $13,880 | -27% |
| Dec 31, 2019 (year close) | $7,160 | -63% |
COVID, Institutions, and New Highs: 2020–2021
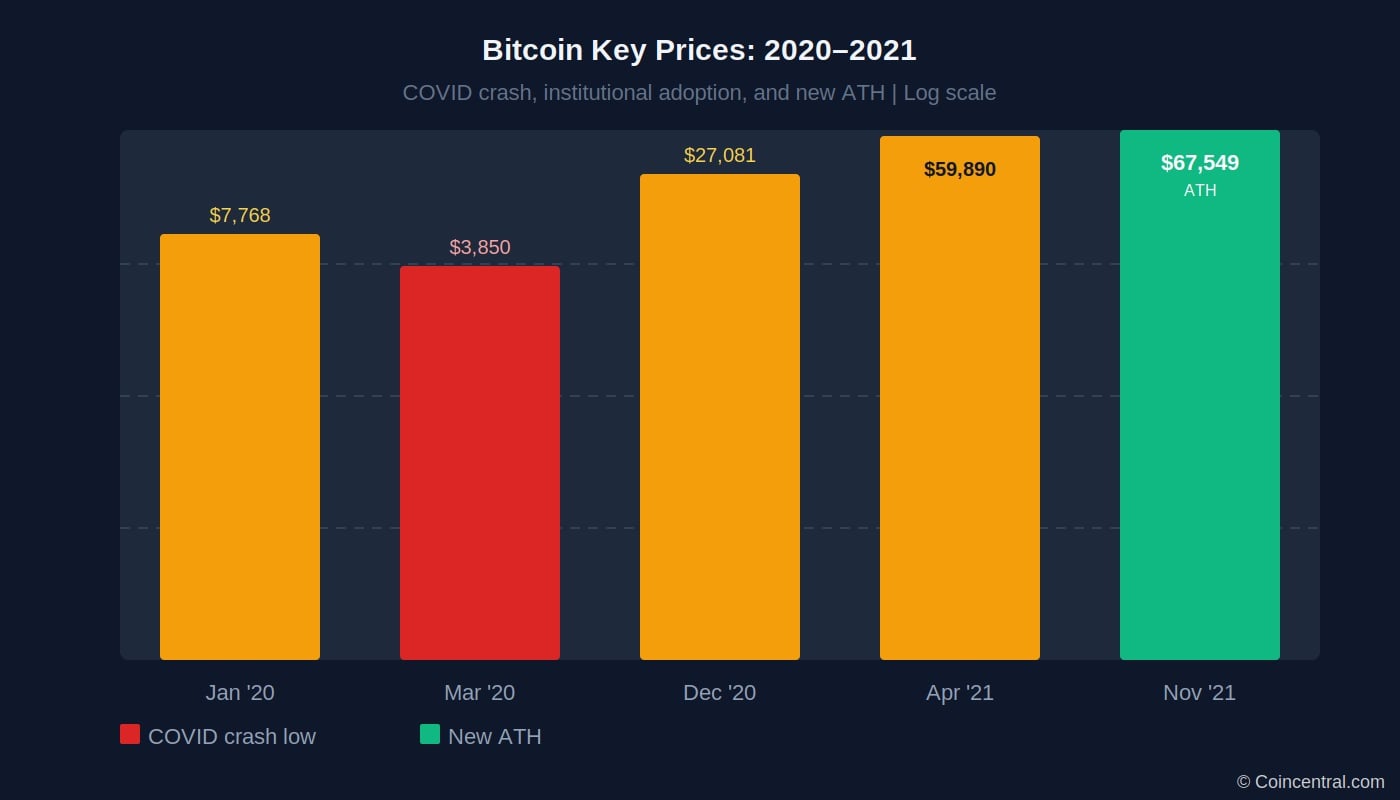
2020 started at $7,768. Then COVID-19 hit global markets in March. On March 12, 2020, Bitcoin fell nearly 40% in a single day, reaching a low of $3,850. The crash happened during a global liquidity event, as investors sold across all asset classes to raise cash.
The recovery was fast. Massive government stimulus programs and near-zero interest rates shifted the investing environment. Bitcoin bounced back above $10,000 by late July. From September through December, it rallied 185% to close 2020 at $27,081, a gain of 248% for the year.
The bigger shift in 2020 was who was buying. MicroStrategy put more than $1 billion into Bitcoin at an average price of $15,964. Square bought $50 million worth of BTC in October 2020. Massachusetts Mutual Life Insurance Company invested $100 million, an unusual move for a conservative insurer.
PayPal launched Bitcoin buying and selling for U.S. users by the end of 2020, giving its 300 million users direct access without a crypto exchange account.
2021 continued the run. Bitcoin crossed $45,000 by February 8. Tesla disclosed a $1.5 billion Bitcoin purchase in February 2021. The price hit $59,890 in April. China banned Bitcoin mining in May 2021, causing a sharp mid-year drop to around $30,000.
The market recovered. Bitcoin set a new all-time high of $67,549 on November 8, 2021. The ProShares Bitcoin futures ETF had launched on the NYSE in October 2021, attracting strong institutional interest.
| Date | Price | Event |
|---|---|---|
| Jan 1, 2020 | $7,768 | Year opens |
| Mar 12, 2020 | $3,850 | COVID crash; -40% in one day |
| Jul 2020 | $10,000+ | Recovery above key level |
| Oct 2020 | – | MicroStrategy: $1B+ in BTC; Square: $50M in BTC |
| Dec 28, 2020 | $27,081 | Year closes; +248% gain for 2020 |
| Feb 8, 2021 | $45,000+ | Tesla: $1.5B BTC purchase disclosed |
| Apr 12, 2021 | $59,890 | Spring 2021 peak |
| Jul 19, 2021 | $30,838 | 50% correction; China mining ban impact |
| Nov 8, 2021 | $67,549 | 2021 all-time high |
The 2022 Crash
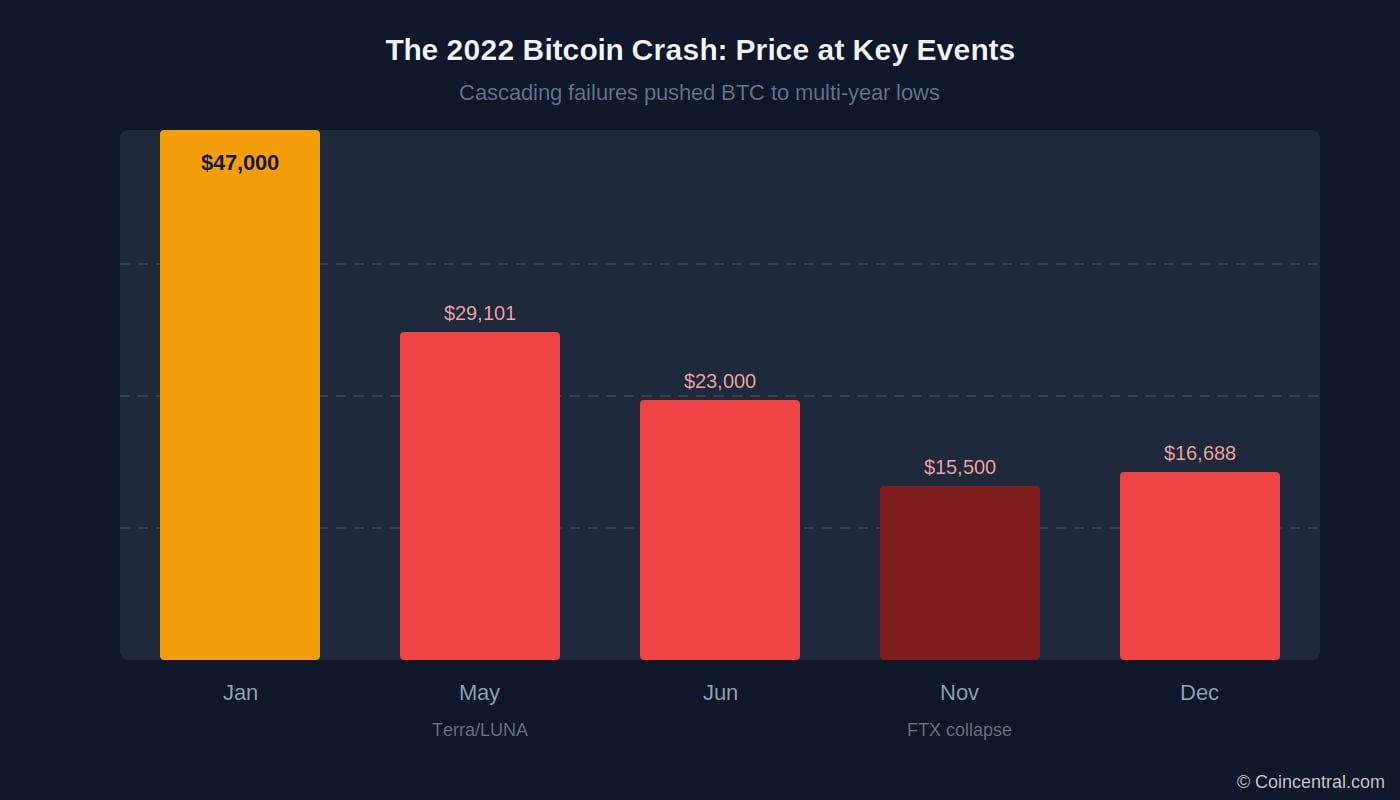
2022 was a year of cascading failures. Bitcoin started the year near $47,000. What followed was the worst sustained crash since 2018, driven not by one event but by several failures in sequence.
In May 2022, the algorithmic stablecoin TerraUSD (UST) collapsed along with its companion token LUNA. Federal Reserve research describes the event as a shock that wiped over $50 billion in value in a single week. Bitcoin fell to $29,101 by May 23, its first close below $30,000 since July 2021.
The problems spread. Three Arrows Capital, a major crypto hedge fund, was ordered into liquidation in June. FTX, one of the largest and most trusted exchanges, filed for bankruptcy in November. BlockFi filed for bankruptcy the same month. Each failure triggered more selling.
The Federal Reserve raised interest rates aggressively throughout 2022, pushing investors toward safer assets. Bitcoin fell to around $15,500 in November, less than 25% of its 2021 all-time high. Bitcoin ended 2022 at roughly $16,688, with a full-year loss of about 65%.
| Date | Price | Event |
|---|---|---|
| January 2022 | ~$47,000 | Year opens near 2021 ATH levels |
| May 23, 2022 | $29,101 | TerraUST/LUNA collapse; first close below $30K since Jul 2021 |
| Jun 13, 2022 | $23,000 | Drops below $23K for first time since Dec 2020 |
| June 2022 | – | Three Arrows Capital ordered into liquidation |
| November 2022 | $15,500 | FTX and BlockFi both file for bankruptcy |
| Dec 31, 2022 | $16,688 | Year closes; -65% from January level |
Recovery, ETFs, and New Records: 2023–2025
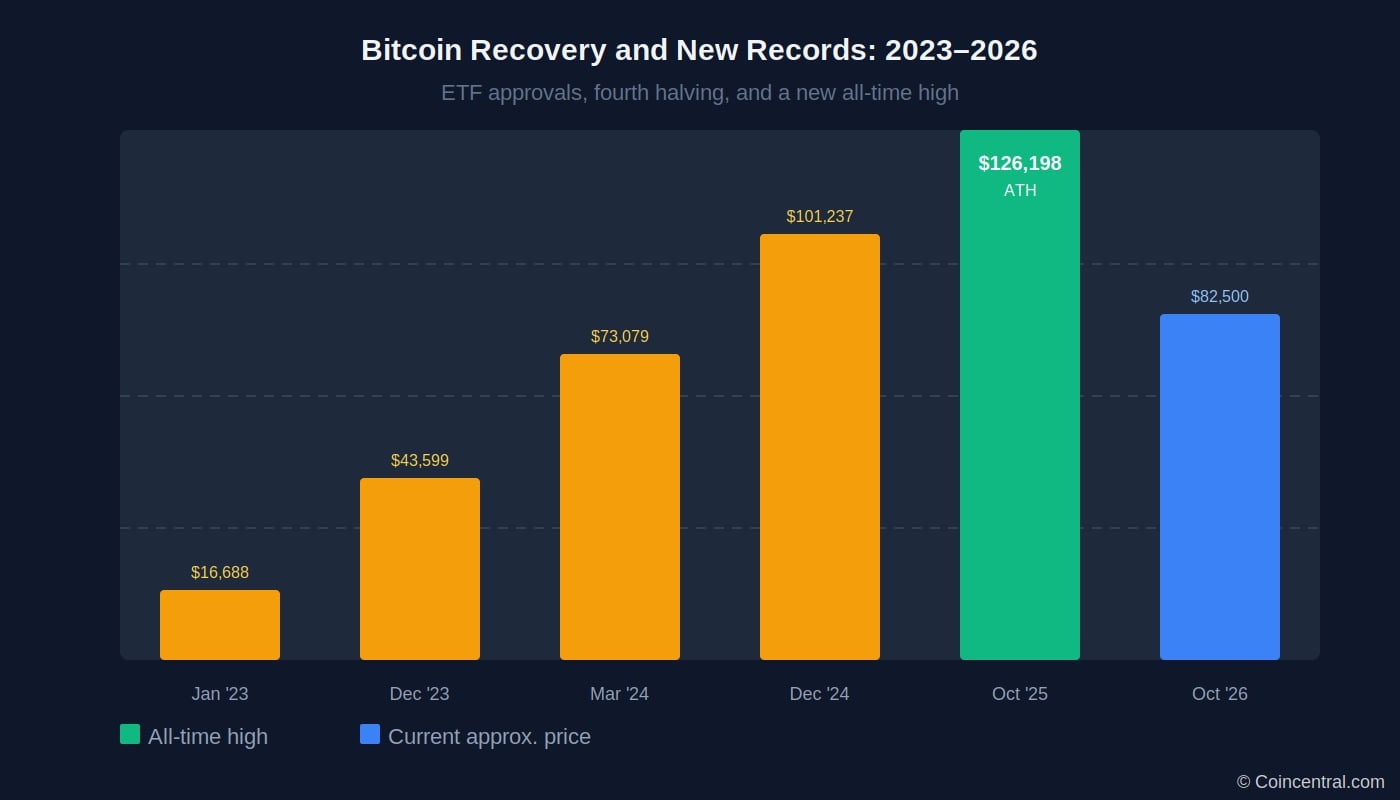
Bitcoin opened 2023 at $16,688 and climbed consistently through the year. It ended 2023 at $43,599, a gain of about 161% with no major crashes during the year. That was a sharp contrast to the turbulence of 2021 and 2022.
The most consequential development came in January 2024. The U.S. Securities and Exchange Commission approved spot Bitcoin exchange-traded funds (ETFs) after years of rejections. For the first time, everyday investors could gain direct Bitcoin exposure through a regulated product on a mainstream stock exchange, without holding crypto themselves.
Bitcoin set a pre-halving record on March 13, 2024, hitting $73,079. The fourth halving arrived on April 19, 2024, cutting the block reward from 6.25 BTC to 3.125 BTC. Bitcoin closed halving day at $63,851. As of December 2025, 33 Bitcoin spot ETFs existed with combined assets of around $124 billion.
Bitcoin broke $100,000 for the first time on December 8, 2024, closing at $101,237. The push past $100,000 followed the U.S. presidential election, with investor optimism around the incoming administration’s stated pro-crypto stance. Bitcoin had previously set a new ATH on November 7, 2024, at $75,902, following the election result.
Bitcoin set its current all-time high of $126,198 on October 6, 2025. The price then pulled back to $84,648 by November 22, 2025, before recovering to $92,119 by December 1.
In 2026, Bitcoin consolidated. Prices ranged between $67,000 and $80,000 through the first half of the year before recovering toward $82,500 by October 2026.
| Date | Price | Event |
|---|---|---|
| Jan 1, 2023 | $16,688 | Opens after 2022 FTX collapse |
| Dec 31, 2023 | $43,599 | +161% gain for full year 2023 |
| January 2024 | – | SEC approves spot Bitcoin ETFs |
| Mar 13, 2024 | $73,079 | Pre-halving all-time high |
| Apr 19, 2024 | $63,851 | 4th halving day close (6.25 to 3.125 BTC) |
| Nov 7, 2024 | $75,902 | Post-election ATH; +9% in one day |
| Dec 8, 2024 | $101,237 | First ever close above $100,000 |
| Oct 6, 2025 | $126,198 | Current all-time high |
| Nov 22, 2025 | $84,648 | Sharp pullback from ATH |
| Oct 2026 | ~$82,500 | Current trading range |
Bitcoin Halving Statistics
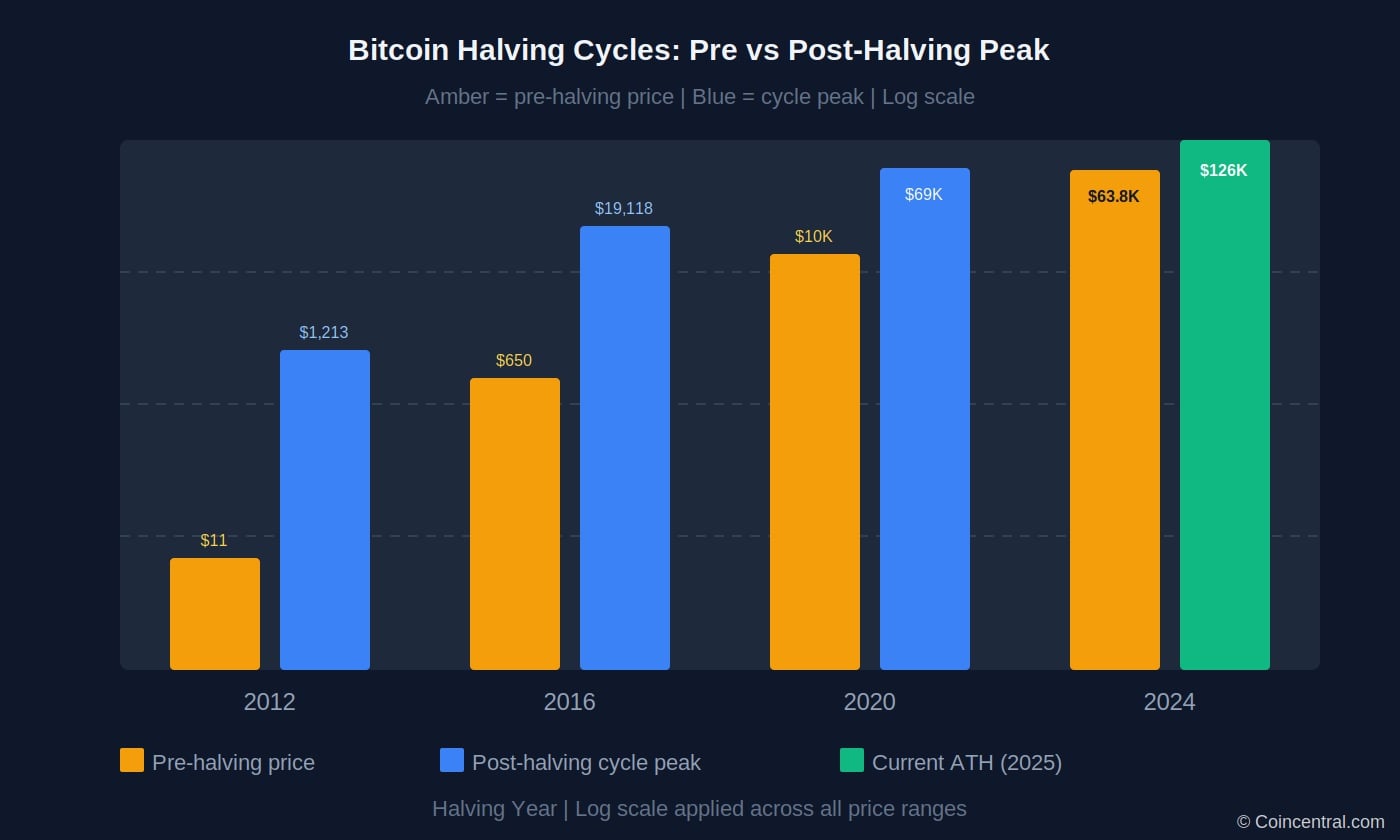
Bitcoin’s supply is capped at 21 million coins. Roughly every four years, the reward miners get for adding new blocks to the blockchain is cut in half. This is called a halving. Four halvings have occurred since Bitcoin launched.
The halving does not directly cause price increases. But the reduction in new supply, if demand stays steady or grows, tends to produce higher prices. Each of the four halvings has been followed by a new all-time high, though the timing between halving and peak has varied.
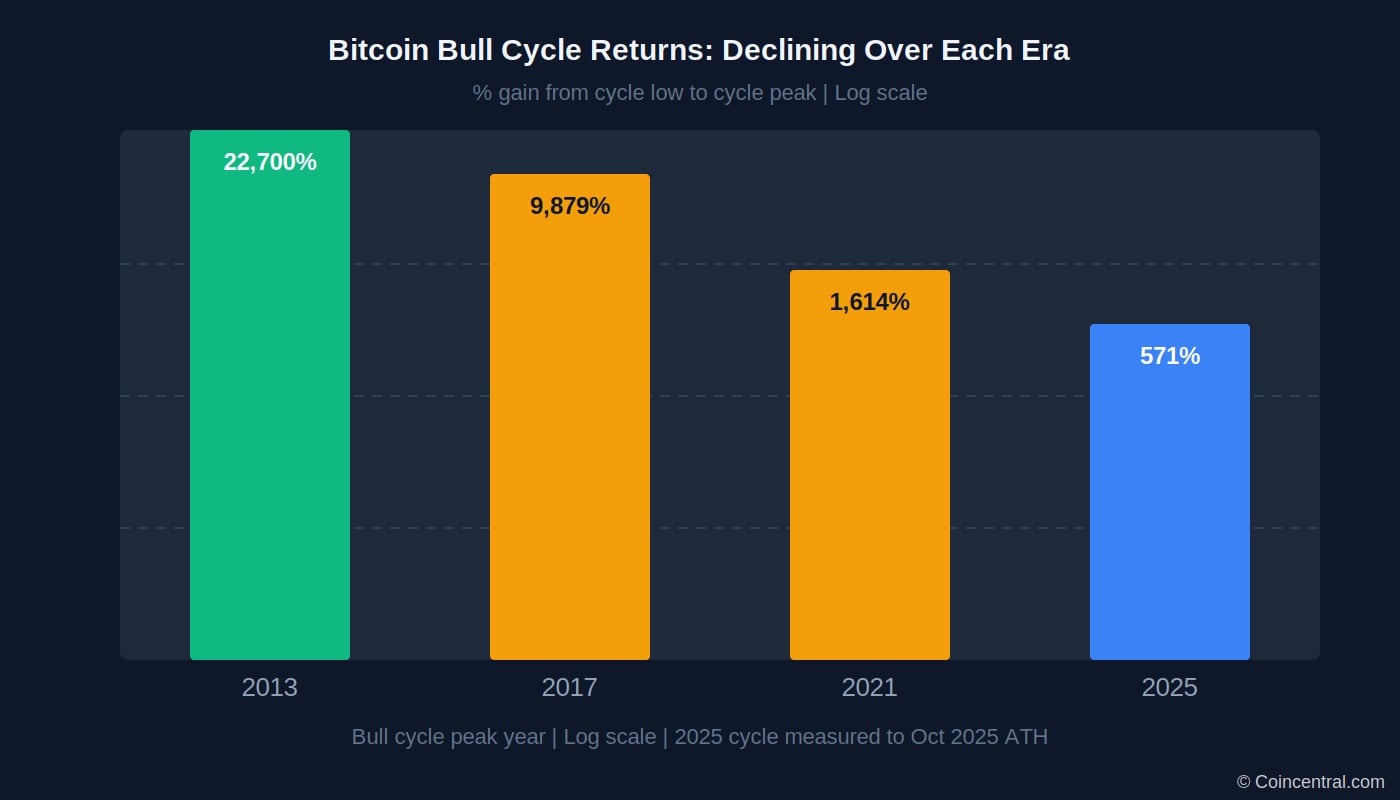
One pattern in the halving data is that percentage gains per cycle have been declining. The 2013 run produced about 22,700% from cycle low to peak. The 2017 run produced 9,879%. The 2021 run produced 1,614%. The post-2024 halving cycle has produced about 571% from its cycle bottom as of the $126,198 peak.
This shrinking pattern makes sense. A larger asset requires more capital to move by the same percentage. As Bitcoin grows in market cap, the same percentage gains become harder to produce.
| Halving | Year | Reward Before | Reward After | Pre-Halving Price | Cycle Peak | Peak Year | Cycle Gain |
|---|---|---|---|---|---|---|---|
| 1st | 2012 | 50 BTC | 25 BTC | ~$11 | $1,213 | 2013 | +22,700% |
| 2nd | 2016 | 25 BTC | 12.5 BTC | ~$650 | $19,118 | 2017 | +9,879% |
| 3rd | 2020 | 12.5 BTC | 6.25 BTC | ~$10,000 | $69,000 | 2021 | +1,614% |
| 4th | 2024 | 6.25 BTC | 3.125 BTC | $63,851 | $126,198 | 2025 | +571% |
What Drives Bitcoin’s Price?
Bitcoin’s price is shaped by the same forces as any other asset: supply and demand. But several factors are unique to how Bitcoin works, and understanding them helps explain the patterns in its price history.
Supply is fixed at 21 million coins. No more can ever be created. As halving events slow the rate of new supply every four years, and if demand holds steady or grows, the price tends to rise. This mechanism is coded into Bitcoin’s protocol and cannot be changed.
Regulatory news has a fast and direct effect on price. China’s 2013 ban on financial institutions using Bitcoin caused an immediate crash. The SEC’s 2024 ETF approval caused a sharp rally. Bitcoin operates in a global regulatory environment, and policy changes in major economies move the price quickly.
Institutional adoption has changed who is buying Bitcoin. Before 2020, most buyers were retail investors and early adopters. After MicroStrategy, Square, Tesla, and several insurance companies entered in 2020 and 2021, the buyer base changed. As of December 2025, 33 Bitcoin spot ETFs held a combined $124 billion in assets, bringing a large pool of institutional capital into the market.
Macroeconomic conditions also drive the price. When interest rates rise, investors often move toward lower-risk assets. When rates fall or governments run large stimulus programs, speculative assets like Bitcoin tend to attract more capital. Research shows Bitcoin has a -0.29 correlation with the U.S. dollar. When the dollar weakens, Bitcoin often rises.
Bitcoin’s daily price volatility has declined over time. In 2021, the daily standard deviation was about 5.3%. By 2025, it had dropped to around 2.1%. That is still above most traditional assets, but the trend is toward a less volatile market as it matures.
Market sentiment also plays a role. The Bitcoin Fear and Greed Index tracks sentiment on a 0-100 scale. Extreme fear has often coincided with price lows. Extreme greed has often coincided with price peaks. Sentiment-driven moves can be fast and sharp in both directions.
Bitcoin has survived bank collapses, exchange failures, regulatory crackdowns, a global pandemic, and multiple cycles of rising interest rates. Each time the price has fallen more than 80%, it has eventually recovered and set new highs. The historical data shows 16 years of that pattern. Whether it continues is not something any data source can tell you with certainty.
Understanding the cycles can help make sense of Bitcoin’s price moves. The numbers show an asset that has consistently attracted new buyers at each stage, even as the percentage gains available per cycle have declined.
Sources
- Bitbo – Bitcoin Price History Chart (Since 2009)
- Investopedia – Bitcoin’s Price History, by John Edwards (Updated June 2026)
- Kraken Learn – Bitcoin Price History Timeline (2009–2025)
- CoinTracker – Bitcoin’s Price Journey: A Data-Driven History From 2009 to 2025
- CoinDesk – Bitcoin Price Data and Historical Charts
- BitcoinTalk Forum – Early Bitcoin trading records and Pizza Day transaction thread
- CoinMarketCap – Bitcoin Historical Price and Market Cap Data
- U.S. Securities and Exchange Commission – Approval of Spot Bitcoin Exchange-Traded Products, January 2024
- Federal Reserve – Research paper on the TerraUSD/LUNA collapse and crypto contagion, 2022
- Investor’s Business Daily – Bitcoin October 2025 All-Time High Report


