






TLDR
- SOL traded around $101–$105, up roughly 4–5% in 24 hours
- Analyst Ali Charts identified $105 as the key resistance level to watch
- A confirmed close above $105 could open a rally toward $130
- Solana ETFs recorded $836,930 in net inflows on September 16
- Solana’s weekly chart shows a potential SMA crossover that analysts say could be a major technical event
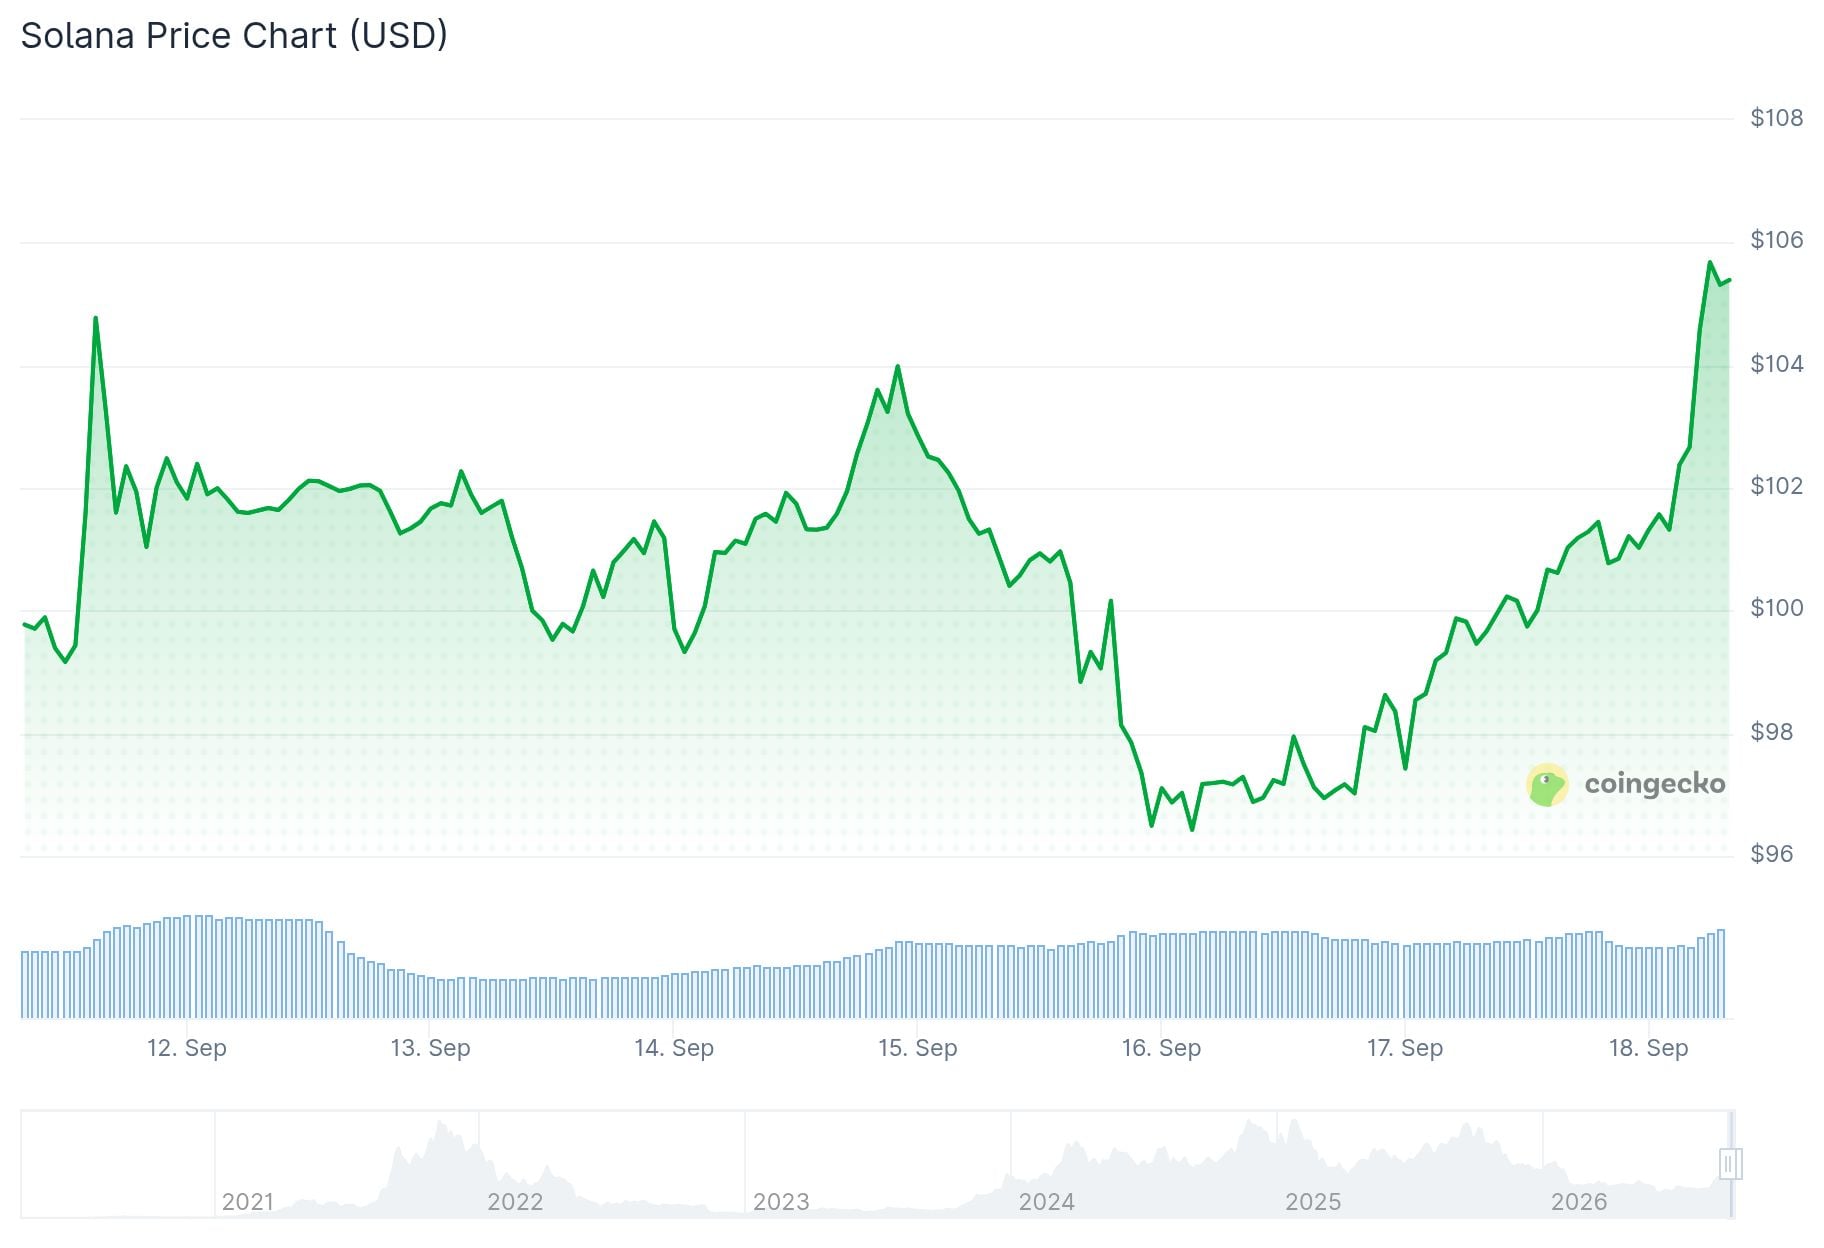
Solana held above the $100 mark on Wednesday after gaining around 5% in the previous 24 hours. At the time of writing, SOL was trading near $101.32, outperforming much of the broader crypto market.
Total crypto market cap rose 2.13% to $2.63 trillion. Bitcoin was near $76,000 and Ethereum around $2,450 during the same period.
Crypto analyst Ali Charts pointed to a bull flag forming on Solana’s four-hour chart. The pattern developed after a prior upward move, followed by a tightening consolidation around the $101 zone.
Ali Charts set $105 as the key level to watch. In a post on X, the analyst wrote: “A sustained close above it could confirm the bullish breakout and open the door to a rally toward $130.” Any move above $105 without a firm close could result in a false breakout, the analyst noted.
SOLANA READY TO GO PARABOLIC
On-chain data shows Solana has built a major support floor around $100, with more than 40 million SOL traded.
But the weekly chart may be even more bullish.
Zooming out, $SOL appears to have spent the last few years building a massive… https://t.co/Z0x09V7DSA pic.twitter.com/8TT6ChDEDO
— Ali Charts (@alicharts) September 18, 2026
SOL’s MACD line sat at -0.10, above the signal line of -0.55, with a positive histogram of 0.44 pointing to improving momentum. The RSI climbed to 59.42, showing rising demand without entering overbought territory.
ETF Inflows and Market Data
Solana ETFs recorded net inflows of $836,930 on September 16, according to SoSoValue. Bitwise BSOL led with $2.69 million in inflows, while Grayscale’s GSOL saw $1.85 million in outflows.

📈ETF DATA: US spot @Solana ETFs saw $1.35M in net inflows yesterday, led by $BSOL, bringing the total net inflows to $1.38 billion.
Track here: https://t.co/8nZJxjLBBF pic.twitter.com/1cGBBbIzu8
— SolanaFloor (@SolanaFloor) September 16, 2026
Total net assets across the seven Solana ETF products reached $1.38 billion, equal to 2.38% of SOL’s market cap. Daily trading volume across those products hit $51.57 million, with BSOL the largest fund at $945.76 million.
Separately, Ali Charts also shared a longer-term view on Solana’s on-chain data, noting that more than 40 million SOL has been traded around the $100 level, forming what the analyst described as a major support floor. The weekly chart, according to Ali Charts, shows a cup-and-handle pattern with a neckline near $360.
SMA Crossover and Tokenized Stocks
On the weekly chart, analyst Trader Tardigrade highlighted an approaching crossover between Solana’s 100-period and 150-period simple moving averages. The analyst cited past instances where a similar crossover preceded a price expansion. Tardigrade set a long-term technical target of $1,000 per SOL, though that remains a trader’s projection rather than a market consensus.
$SOL/weekly — Expansion Phase ❇️#Solana came down from a downtrend and reached the base. The 100 SMA and 150 SMA converged and are now forming a crossover.
📊 Base formation complete
🟢 SMA crossover forming
🚀 Historical pattern: crossover = expansion✍️ This exact pattern… pic.twitter.com/KgFaBDhLfr
— Trader Tardigrade 🧬 (@TATrader_Alan) September 17, 2026
Solana also saw activity on the tokenization front. Solflare added over 750 tokenized equities to its xStocks listing, including stocks from Nike, Disney, and Airbnb.
On September 17, the SEC announced a five-year conditional exemption to support certain blockchain-based trading of tokenized stocks and securities, easing some standard exchange and dealer requirements.
SOL was trading near $100.14 with a 24-hour volume of $6.27 billion and a market cap of approximately $59 billion at the time of the second report.


