





TLDR
- SOL is trading around $76.80, up 2.66% in 24 hours, testing the upper boundary of a descending channel near $76
- RSI sits at 42 on the daily chart, with MACD in negative territory, signaling continued weak momentum
- Key resistance levels sit at the 50-day EMA ($76.32), 200-day EMA ($92.59), and a moving average cluster between $108–$123
- Circle minted 250 million USDC on Solana, adding stablecoin liquidity to the network
- Analysts identify targets at $84, $123, and $140 if SOL confirms a breakout above current resistance
Solana is trading around $76.80 at the time of writing, up roughly 2.66% over the past 24 hours. Daily trading volume sits near $1.31 billion.
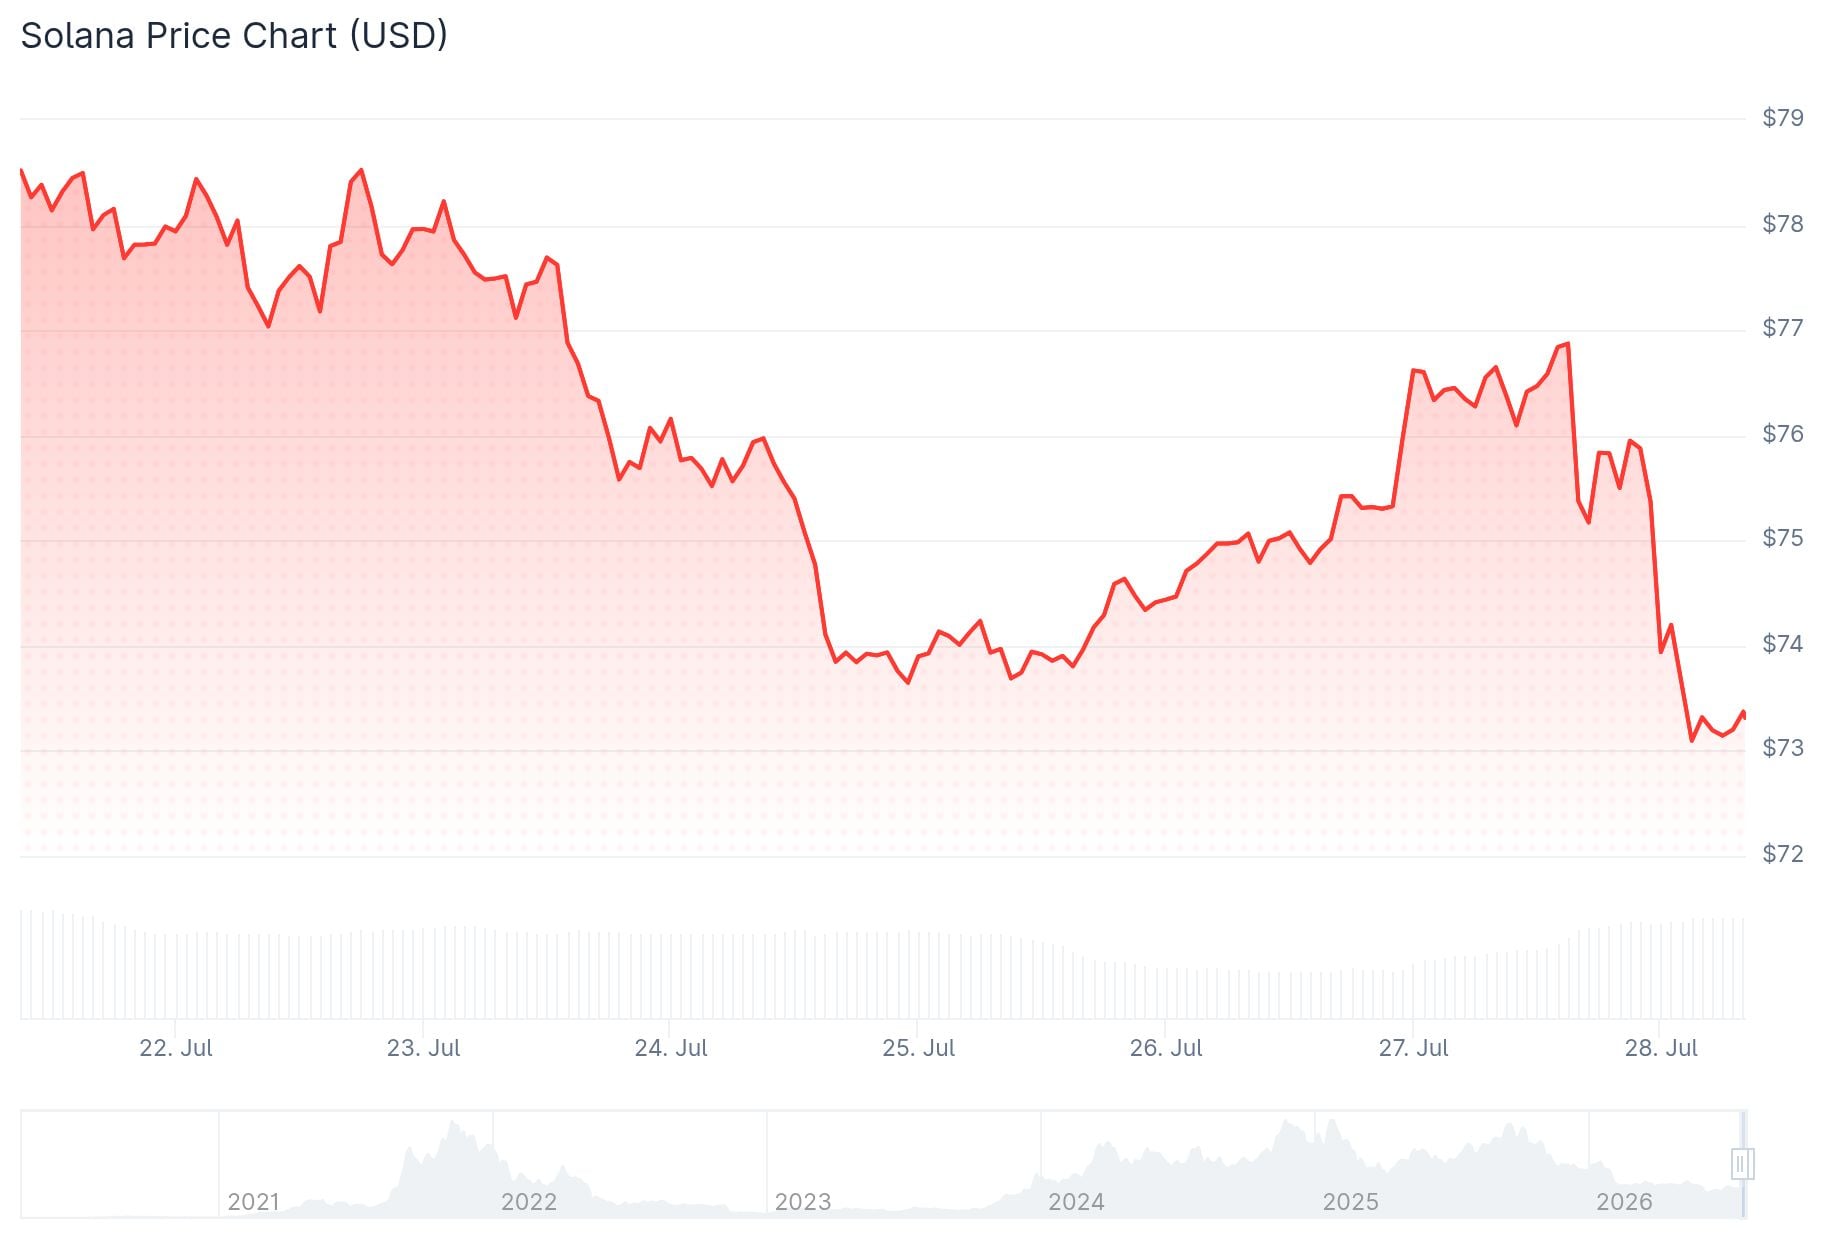
The price is currently testing the upper boundary of a short-term descending channel near $76. On a four-hour chart, SOL has been forming higher lows inside the channel, and the RSI has moved to around 59.86, above its signal line at 48.03.
A confirmed close above the channel could open the path toward $80–$84. A failure to hold could push price back toward the $74–$75 support zone.
On the daily chart, the picture is more cautious. The RSI sits near 42, indicating weak demand, and the MACD remains below its signal line. Both the 50-day EMA at $76.32 and the 200-day EMA at $92.59 sit above current price, acting as overhead resistance.
If selling pressure increases, downside targets include the February 6 low at $67.50 and the June 6 low at $60.13.
Weekly Chart Shows Demand Zone Holding
On the weekly timeframe, SOL continues to trade inside a broad demand zone that has attracted buyers during previous pullbacks. Analyst Crypto King noted on X that SOL still has one of the cleaner high-timeframe setups in the market, describing the current level as a high demand zone and suggesting accumulation remains the preferred strategy while that level holds.
$SOL 1W chart:$SOL still has one of the cleanest high-timeframe setups.
That marked zone is still a high demand zone, as long as that level continues to hold, accumulating is the best move. pic.twitter.com/dd6XAPbuVd
— Crypto King (@CryptoKing4Ever) July 27, 2026

The weekly RSI sits near 40.10, showing momentum is still recovering but not yet overheated.
Analyst Maps Path to $143
Crypto analyst Gum has pointed out that resistance between $75 and $140 is relatively thin and spread across a wide range rather than concentrated in one zone. The 20-week EMA near $83.75 is the first key level to reclaim. Above that, moving averages cluster between $108 and $123. The yearly open near $143.44 is the next major higher-timeframe target if Solana clears that cluster.
$SOL there's air between $75 and $140
Bullish af
Pointless to time a move that is almost guaranteed to come eventually pic.twitter.com/cAP8974E6D
— gum (@gumsays) July 27, 2026
Circle minted 250 million USDC on Solana, which increases stablecoin liquidity available across the network for DeFi, payments, and trading. This adds a fundamental layer to the technical setup, though price still needs to confirm the breakout on its own terms.
SOL is currently holding support at $74–$76 while testing descending channel resistance. The weekly demand zone remains intact with the yearly open near $143.44 as the next major higher-timeframe target.


