






TLDR
- SOL trades near $101.45 after three straight weekly losses, including a 2% drop last week.
- Solana ETFs saw $17.30 million in outflows last week, bringing the monthly total to $72.24 million.
- Futures open interest fell to about $6.18 billion–$6.27 billion from $6.34 billion, depending on the source.
- SOL sits below its 50-day EMA ($105.99) and above its 200-day EMA ($98.27).
- Analyst Ted Pillows says SOL looks like Q3 2023, with a possible dip below $90 before a rally.
Solana (SOL) held above $100 on Monday, trading near $101.45 after three straight weeks of losses. The token fell 2% last week, keeping its near-term outlook under pressure.
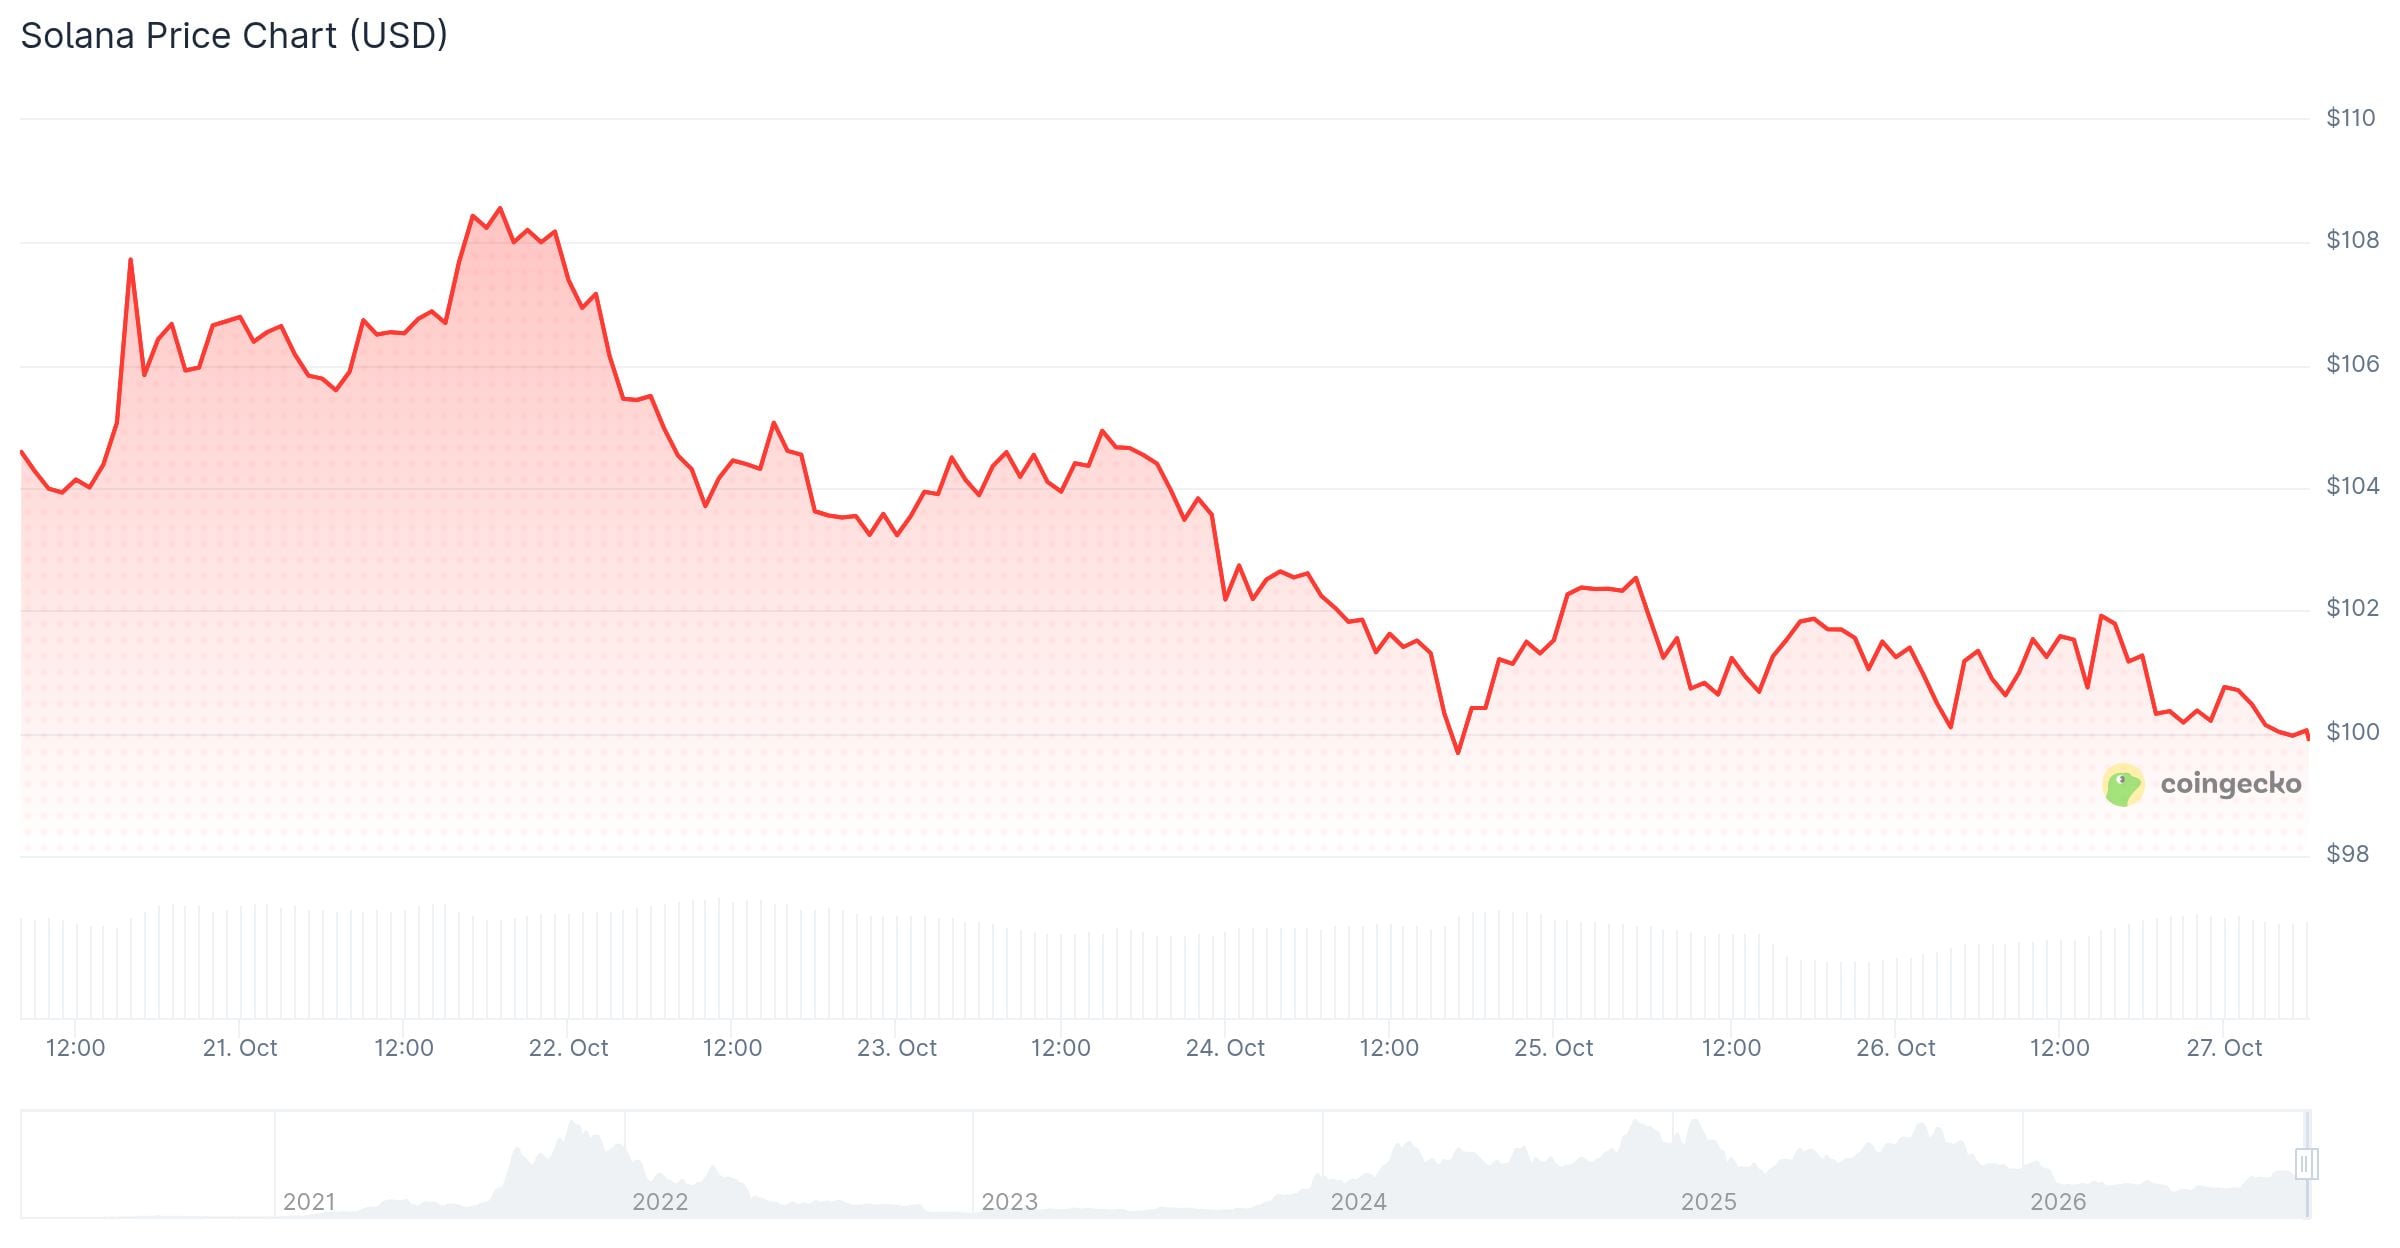
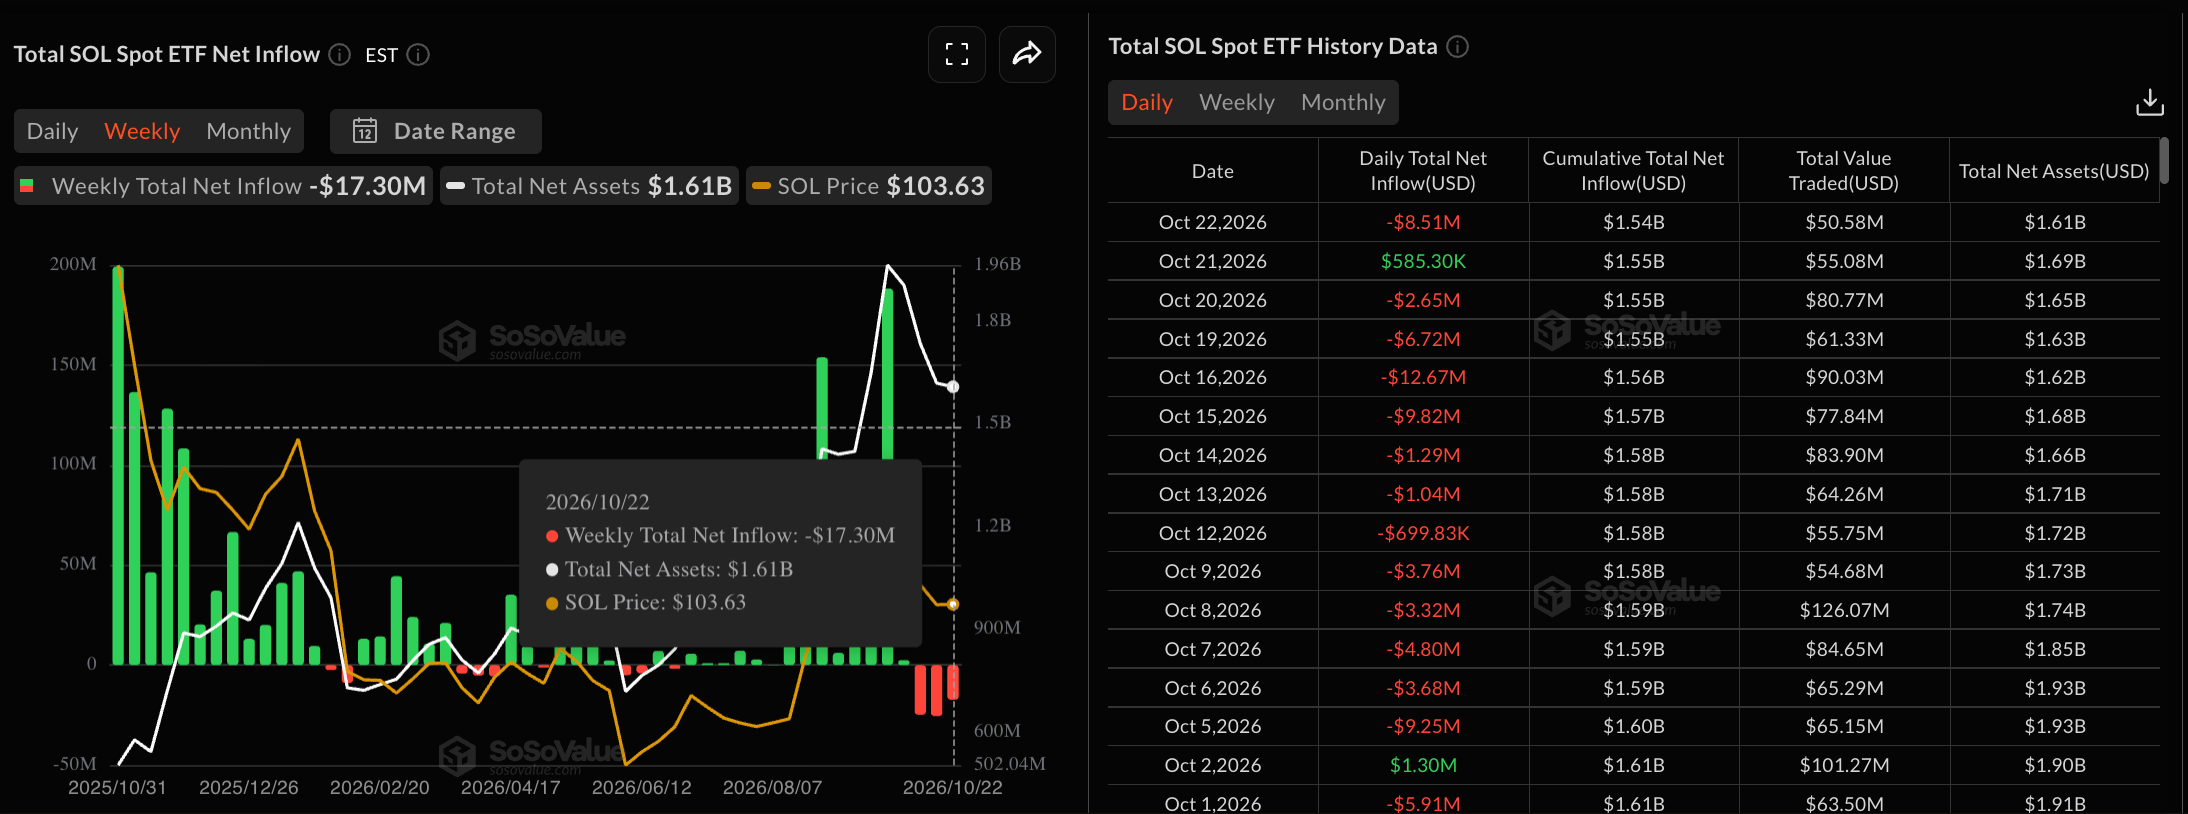
Solana-focused exchange-traded funds recorded $17.30 million in net outflows last week, according to SoSoValue data. It was the third weekly outflow in a row.
The withdrawals bring the monthly total to $72.24 million. Funds linked to SOL have lost a steady stream of investor money in recent weeks.
Derivatives Activity Cools
Futures activity has also slowed. CoinGlass data shows SOL futures open interest at about $6.18 billion–$6.27 billion on Monday, down from $6.34 billion a week earlier.
That is a drop of roughly 2% in the dollar value of open contracts. A falling spot price can also lower open interest, so the figure does not show who closed positions or why.
The weakness comes despite last week’s Alpenglow upgrade. The update replaced the TowerBFT system with a new consensus engine called Votor.
Votor targets a cut in transaction finality from about 12 seconds to 150 milliseconds. The upgrade has not yet led to a lasting price recovery.

Analyst Ted Pillows offered a longer view on X. He said SOL looks very similar to its Q3 2023 setup, and suggested a possible dip below the $90 level could be followed by a strong rally.
$SOL looks very similar to Q3 2023 now.
Maybe a dip in the sub-$90 level followed by a strong rally. pic.twitter.com/OowZDFforB
— Ted (@TedPillows) October 26, 2026
Technical Levels to Watch
SOL trades below its 50-day exponential moving average (EMA) at $105.99. It remains above the 200-day EMA at $98.27.
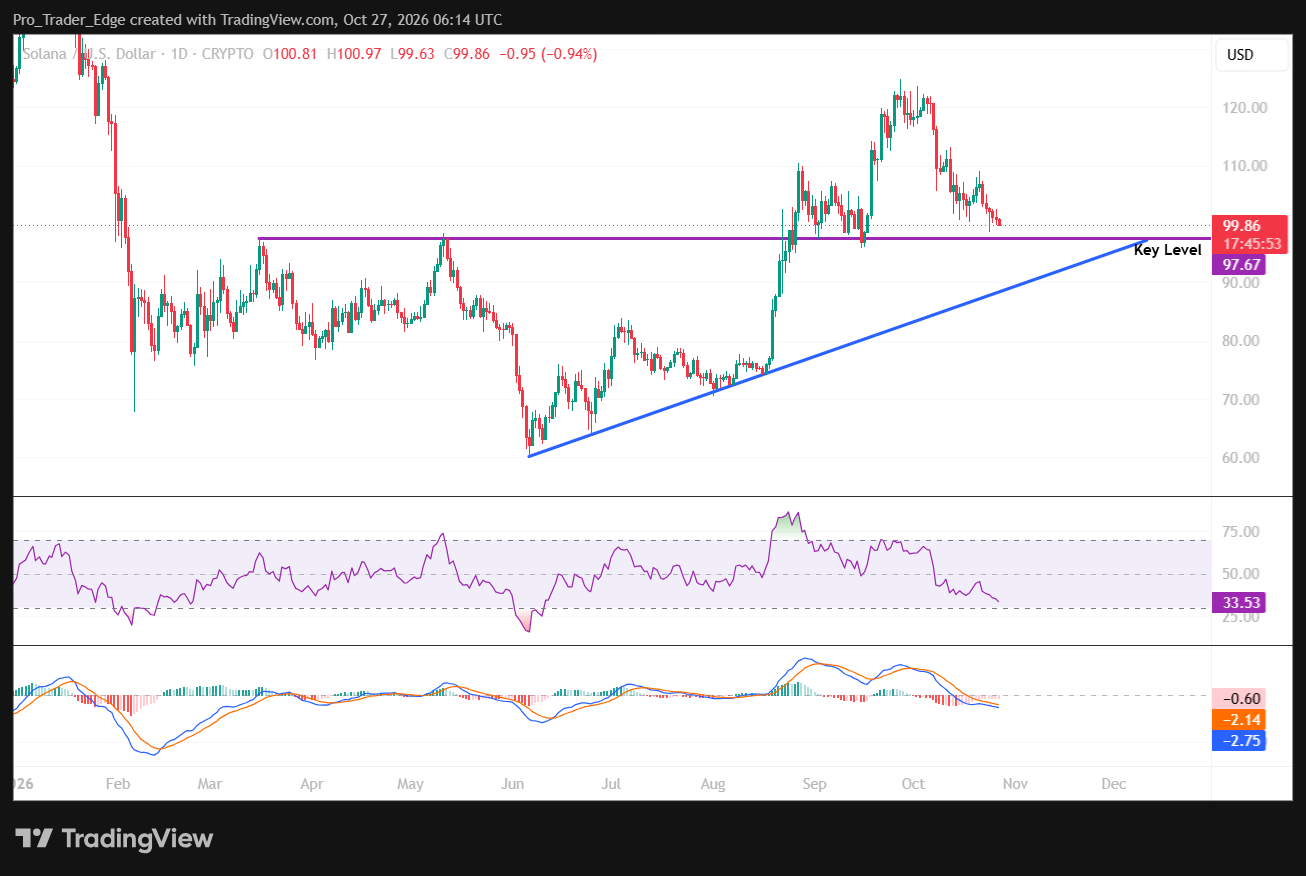
This split points to a corrective phase within a broader uptrend. An upward-sloping support trendline near $86.67 also supports the structure.
Momentum is soft. The daily Relative Strength Index (RSI) sits at about 36, above the usual oversold line.
The Moving Average Convergence Divergence (MACD) line is slightly below its signal line in negative territory. That shows downside momentum remains in place.
The 200-day EMA at $98.27 is the first major support. A confirmed break below it could open a move toward the trendline near $86.67.
On the upside, the 50-day EMA is the first resistance. Invezz places that area near $107.33, while FXStreet lists it at $105.99.
Beyond that, the September 25 high of $122.94 is the next major barrier. The most recent data shows SOL trading at $101.45 on Monday, October 26.


