





TLDR
- SOL rose nearly 25% in 7 days, hitting the $90 target after the SEC proposed a new crypto regulatory framework
- Over $4.6 billion in short positions were liquidated in 3 days, with August 18 seeing the 8th largest single-day liquidation in crypto history
- The Crypto Fear and Greed Index jumped from 36 to 76, shifting sentiment from neutral to greedy
- An on-chain signal — a crossover between 30-day and 50-day moving averages for daily active users — last triggered a 70% SOL rally from $145 to $245
- ETF net inflows hit $38 million, the highest since May, while analysts watch the $83 level as a potential pullback target
Solana (SOL) has climbed nearly 25% over the past seven days, pushing above the $90 price level for the first time in months. The move followed the U.S. Securities and Exchange Commission’s proposal of a new regulatory framework for crypto assets.
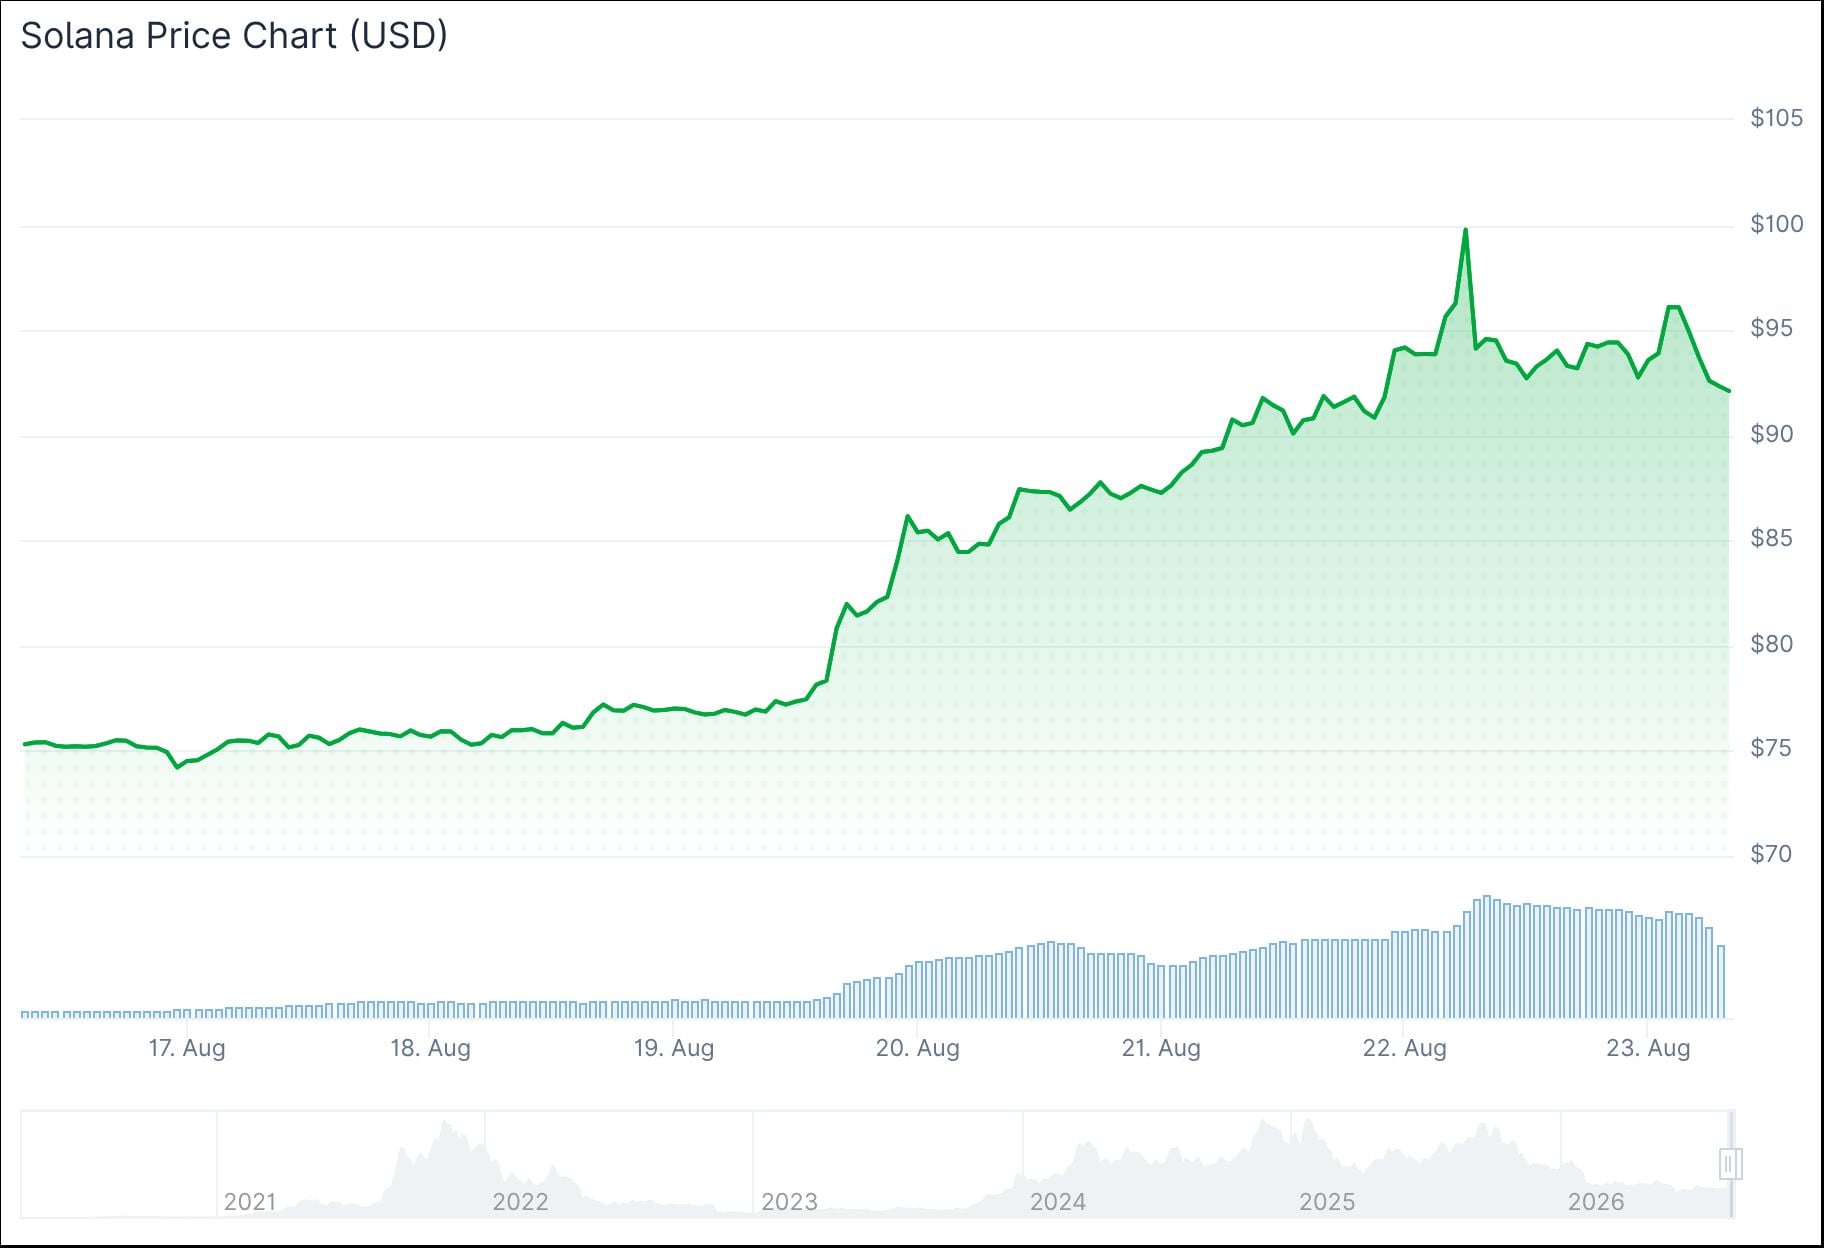
Trading volume surged by nearly 50% to $9.5 billion, representing 17% of SOL’s circulating market cap. The spike above key resistance levels triggered a cascade of short liquidations across the market.
More than $4.6 billion in short positions were wiped out in just three days. August 18 alone saw $2.9 billion in liquidations — the 8th largest single-day wipeout in crypto market history.
BREAKING: Solana, $SOL, surges above $100 for the first time since February 3rd as the crypto rally gains momentum. pic.twitter.com/czVtnnGT2I
— The Kobeissi Letter (@KobeissiLetter) August 22, 2026
SOL broke above both the 200-day exponential moving average (EMA) and two former supply zones at $78 and $90. These had been key resistance areas for months.
On August 21, Solana closed at $93.72, up 6.94% on the day. Financial news account The Kobeissi Letter posted that SOL had surged above $100 for the first time since February 3rd, describing it as the crypto rally gaining momentum.
On-Chain Signal Returns
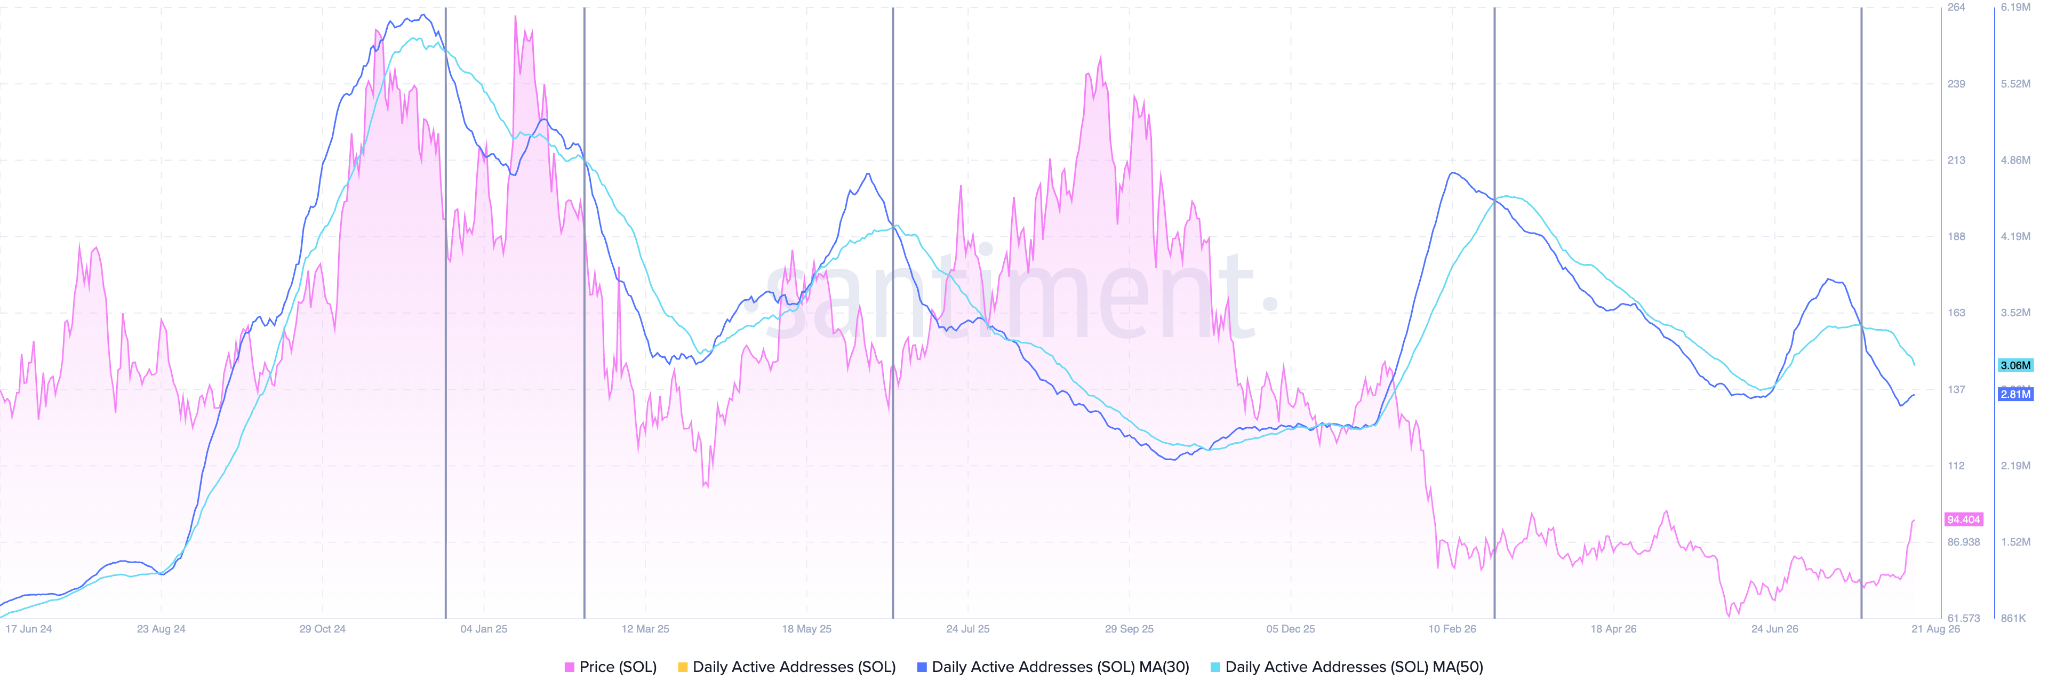
An on-chain signal that previously preceded a major rally has appeared again. A crossover between the 30-day and 50-day moving averages for daily active users (DAUs) last triggered in June 2025, after which SOL climbed from $145 to $245 in just a few months.

That same crossover has now reappeared on the Santiment chart for Solana daily active addresses.
ETF net inflows tied to SOL have reached $38 million — the highest positive reading since May. This adds to the case that institutional interest is returning to the asset.
Market sentiment has shifted sharply. The Crypto Fear and Greed Index moved from around 36 (neutral) to 76 (greedy) within the week.
What Analysts Are Watching
The RSI has entered overbought territory following the rapid price move. A large upper wick on today’s candle shows that selling pressure is building near current levels.
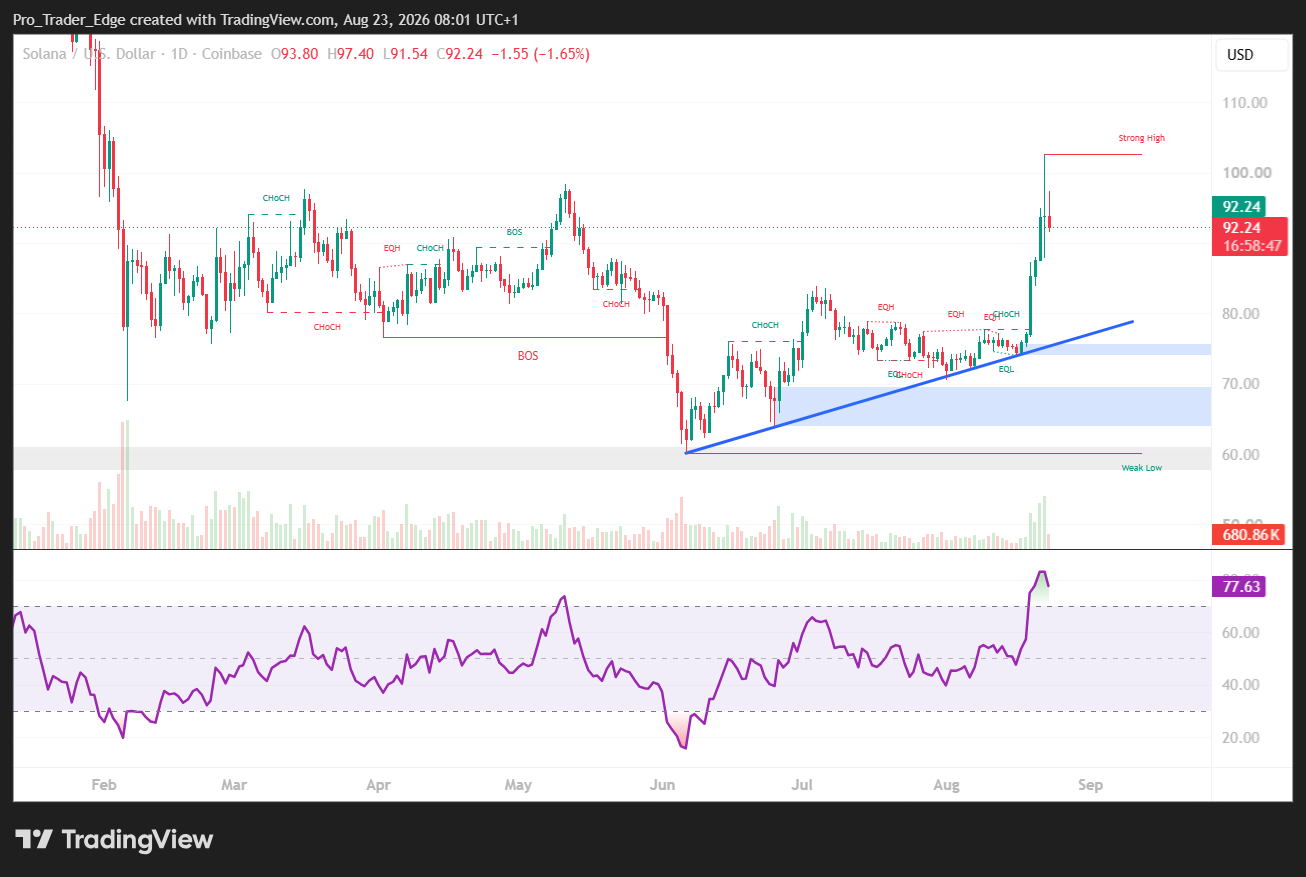
Analysts are watching the $83 level as a potential pullback target if profit-taking accelerates. The 200-day EMA sits nearby and could act as support.
Prior to this week, SOL had tested $90 at least twice without holding it. Thursday’s close above that level is the first convincing settlement above $90 during this period.
If Solana holds above $90 in the coming sessions, the next technical reference point is the mid-$120s. If it fails, the pattern of lower highs would remain intact.
The most recent data shows SOL trading at $91.89, down 9.15% on the day, suggesting early signs of the expected pullback are already underway.


