





TLDR
- SOL rose 8.70% in 24 hours, trading near $97.09 with a market cap of ~$56.56 billion
- SOL broke above $90 for the first time in three months, clearing two key supply zones
- Over $4.6 billion in short positions were liquidated in just three days
- SOL has spent 202 days inside an accumulation range, with $95–$100 as the key breakout level
- If $100 breaks and holds, analysts point to $120 as the next major target
Solana has made one of its strongest moves in months, climbing from the low $80s to nearly $97 in a matter of days. The token is up 8.70% in the past 24 hours and has gained around 25% over the past week.
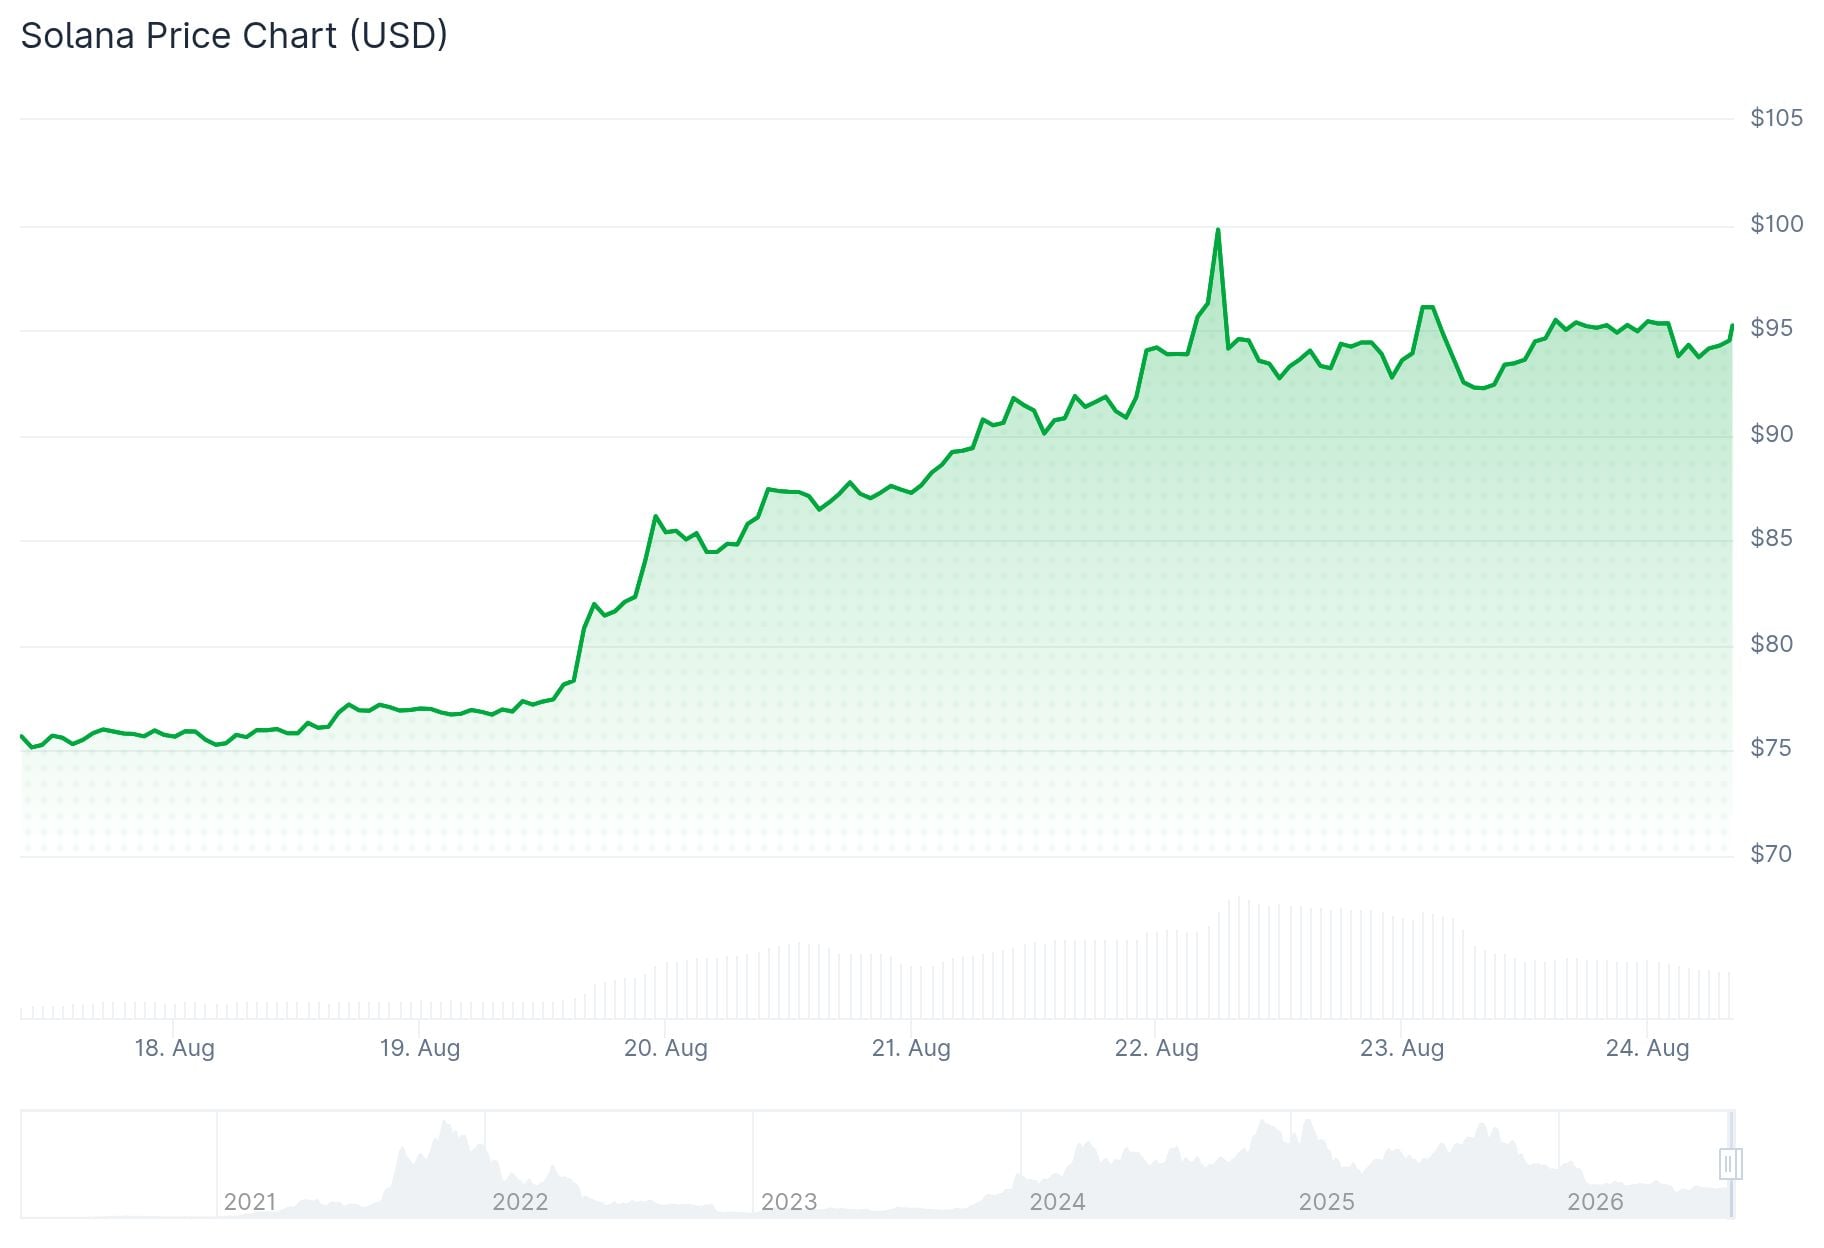
Trading volume has surged nearly 50% to $9.5 billion, equal to about 17% of SOL’s circulating market cap. That spike in volume helped trigger a large short squeeze across the market.
Over $4.6 billion worth of short positions were liquidated in just three days as SOL pushed higher. August 18 alone saw $2.9 billion in liquidations, making it the 8th largest single-day wipeout in crypto market history.
The rally came after the U.S. Securities and Exchange Commission proposed a new regulatory framework for crypto assets. That news shifted sentiment across the market.
The Crypto Fear and Greed Index moved from around 36, which is neutral, to around 76, signaling that investors have turned greedy.
SOL also broke above its 200-day exponential moving average and cleared two former supply zones at $78 and $90. Breaking above $90 was the first time in more than three months that SOL traded at that level.
202-Day Accumulation Comes to a Head
Market analyst Ran Neuner pointed out that SOL spent around 202 days inside its accumulation range before this move. The upper boundary of that range sits right around the $97–$100 area, which price is now testing directly.

$SOL is $8 away from a breakout. It spend 202 days in the accumulation range., the longest of any major If it does break out – it will be violent. pic.twitter.com/tJjz0E5F9Z
— Ran Neuner (@cryptomanran) August 21, 2026
A daily close above $100, followed by a successful retest, would confirm that the range has resolved to the upside. Analyst Altcoin Sherpa has identified $120 as the next major resistance level if that happens.
Crypto trader KillaXBT shared publicly that SOL is up 50% from his entry point. He sees $100–$105 as the local barrier for now, but expects a squeeze into the $120s once that level breaks.
Patience, young ones. $SOL is up 50% from the entry I shared publicly.
100–105 should be the local barrier for now, but once it breaks, prepare for a nice squeeze into the 120s. https://t.co/PyIB7Wr1zr pic.twitter.com/4Z1b4HcWBR
— Killa (@KillaXBT) August 22, 2026
On-Chain Data Backs the Move
Net inflows to Solana ETFs have hit $38 million, the highest positive reading since May. A crossover between the 30-day and 50-day moving averages for daily active users also flagged ahead of the move.

The last time this same crossover appeared, in June 2025, SOL rose from $145 to $245 over the following months.
Key Levels to Watch
Immediate support sits at $90–$92. A deeper pullback could revisit $83, where the 200-day EMA now sits. The RSI has entered overbought territory, which raises the chance of a short-term pullback before any continuation.
Solana’s key levels are: support at $80–$82, resistance at $95–$100, and upside targets at $110–$120, then $140, and longer-term $200.
Net inflows to Solana ETFs currently stand at $38 million, the highest since May.


