





TLDR
- Standard Chartered set a $250 year-end target for Solana, requiring a 107% gain in under three months.
- SOL trades near $121, almost the same level it held back in February when the target was set.
- Solana ETFs saw a 40% jump in net inflows during September, reaching $271 million.
- Validators doubled Solana’s disinflation rate on September 26 to slow new coin issuance.
- App fees on Solana topped $100 million for a second straight week, the highest since August 2025.
Solana (SOL) is trading around $121 as of October 5, 2026, leaving a large gap between its current price and the $250 target set by Standard Chartered. Analyst Geoff Kendrick issued that forecast back in February, and the token has made little headway toward it since.
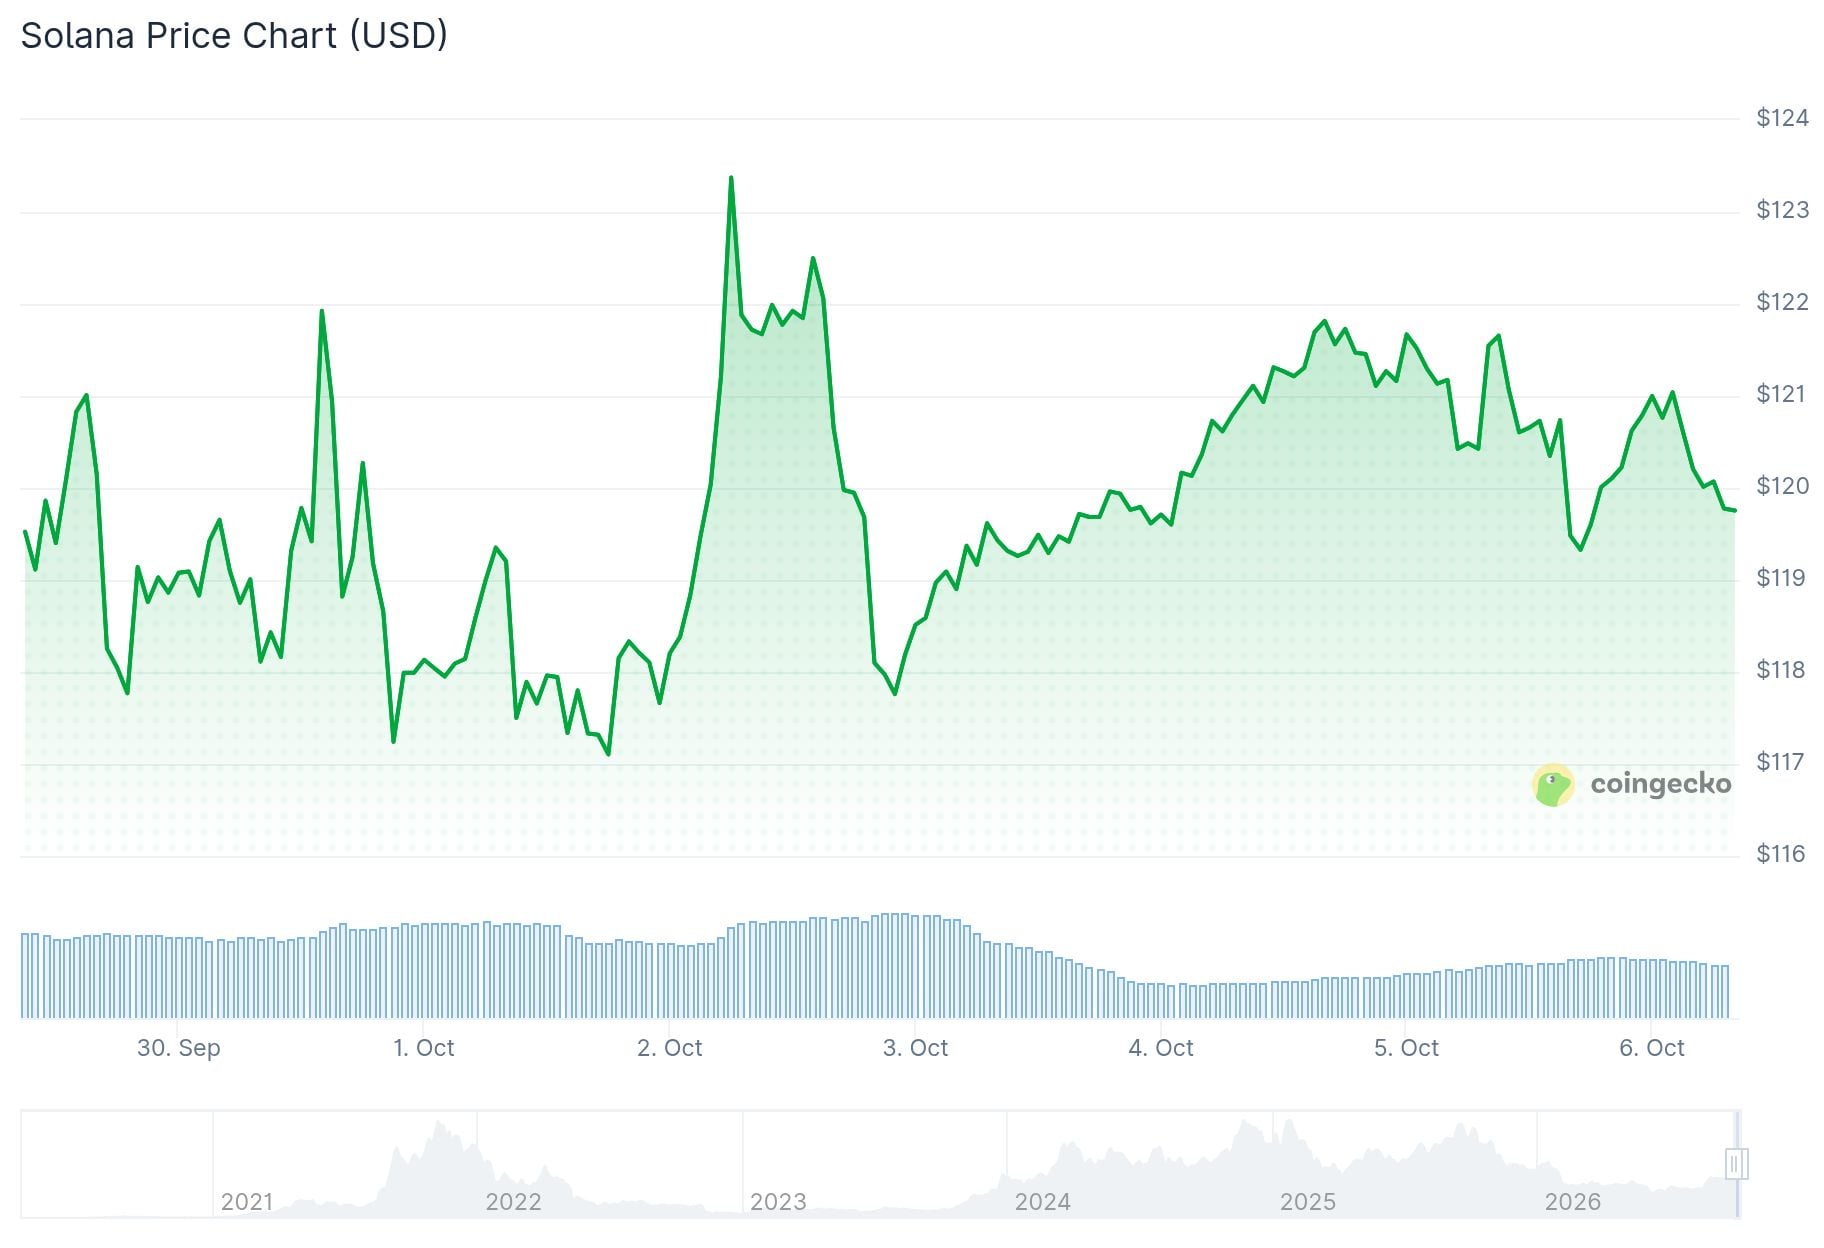
To hit $250 by December, Solana would need to gain about 107% in under three months. That would push its market cap from roughly $71 billion to around $147 billion.
Standard Chartered actually lowered its 2026 target in February, cutting it from $310 to $250. At the same time, Kendrick raised his longer-term targets, including a new $2,000 forecast for 2030.
Standard Chartered’s Model Points to Stablecoin Activity
Kendrick’s targets are based on comparing Solana’s network value to the economic activity happening on it. He pointed to a shift in decentralized exchange trading toward SOL and stablecoin pairs as one driver.
He also expects automated AI software to use Solana for small payments, taking advantage of the network’s low transaction fees. However, he noted Solana could lag behind Ethereum in 2026 and 2027 until payment volume rises enough to lift the price.
Solana has gained about 18% in the past month. Despite that move, the token remains 59% below its all-time high of $293, which it reached in January 2025.
Solana’s circulating supply currently stands at 588 million coins. The token has no maximum supply, so new coins are issued continuously to stakers, adding supply that buyers would need to absorb during any rally.

On September 26, Solana validators approved a decision to double the network’s disinflation rate. This move slows the pace at which new coins enter circulation, though it does not by itself create new demand.
Analyst Sweep, who posts under the handle @0xSweep, said Solana is repeating a pattern it showed last month. He described the token as moving through an expansion phase followed by accumulation, and said SOL is currently in that accumulation stage. Sweep added that a drop below $110 is possible before the next leg up begins.
$SOL is doing exactly what it did last month
First expansion and then accumulation
Right now SOL is in the accumulation phase with a drop below $110 possible
Once that completes the next leg up will start pic.twitter.com/t5OJNANx6j
— Sweep (@0xSweep) October 4, 2026
ETF Inflows and On-Chain Activity Show Gains
Net inflows into Solana-linked ETFs rose 40% in September, reaching $271 million compared to $194 million in August. Trading volumes for SOL sit at $2.3 billion, equal to about 3.2% of its circulating market cap.
Daily active addresses on the Solana network have shown a steady increase. Data from Santiment shows a bullish crossover between the 30-day and 50-day moving averages for this metric.
Fees collected by Solana decentralized apps, including Pump.fun, topped $100 million for the second week in a row. The last time fees reached this level was August 2025.
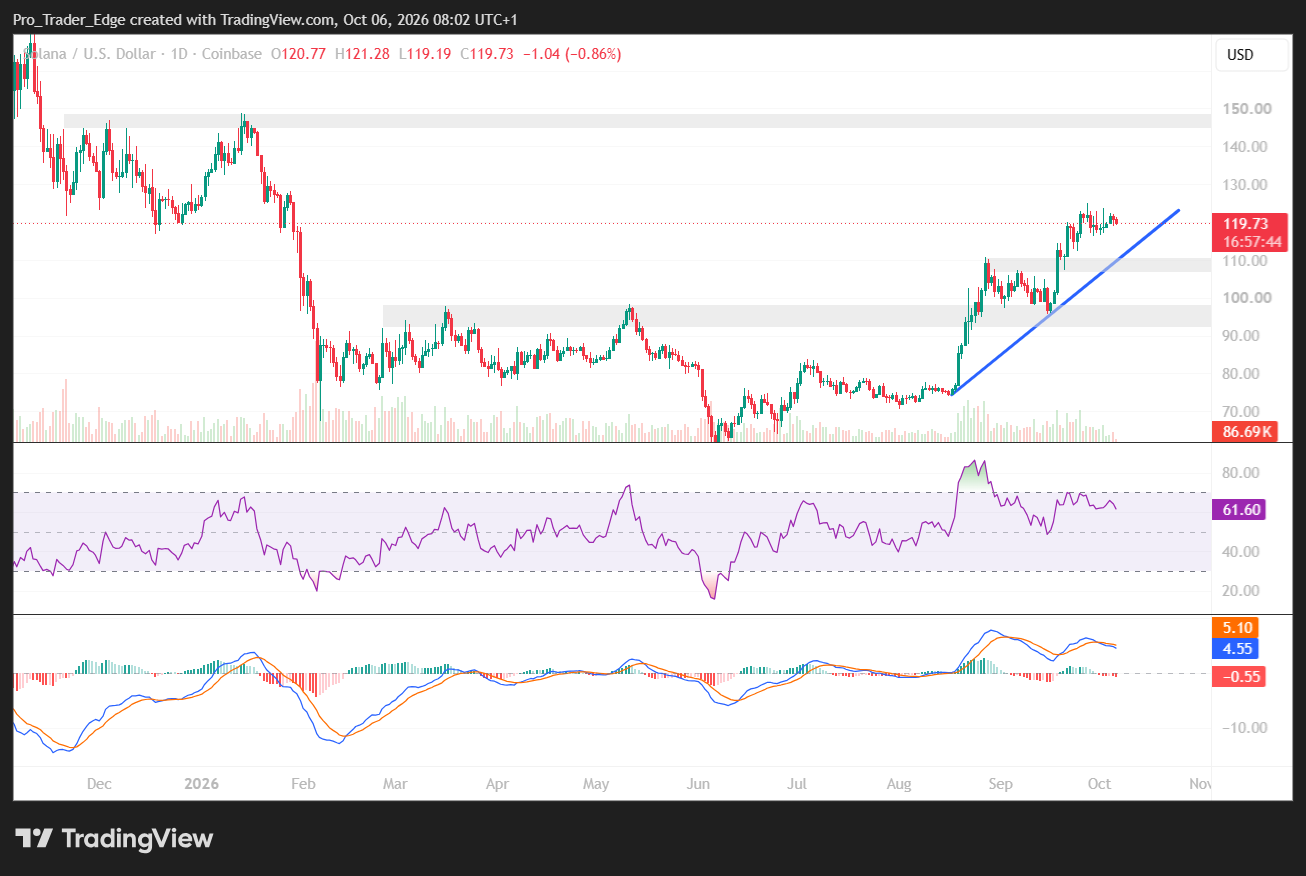
On the charts, SOL faces resistance at the $120 level. The Relative Strength Index currently reads 64.
If the price breaks above $125, traders are watching for a possible move toward $150. A pullback toward the $110–$115 zone remains a scenario some traders are tracking if buying pressure fails to clear the resistance.


