





TLDR
- A whale withdrew 57,000 LINK ($612,550) from Binance in four transactions within 18 hours.
- LINK trades near $10.85, with support at $10.71 and resistance at $10.97 to $11.00.
- RSI sits near 40, and the price is below its shorter-term moving averages.
- Analyst Investor Jordan sees a double bottom with a $15 target, about 38% above the current price.
- Michaël van de Poppe thinks LINK may be bottoming out or may have already bottomed.
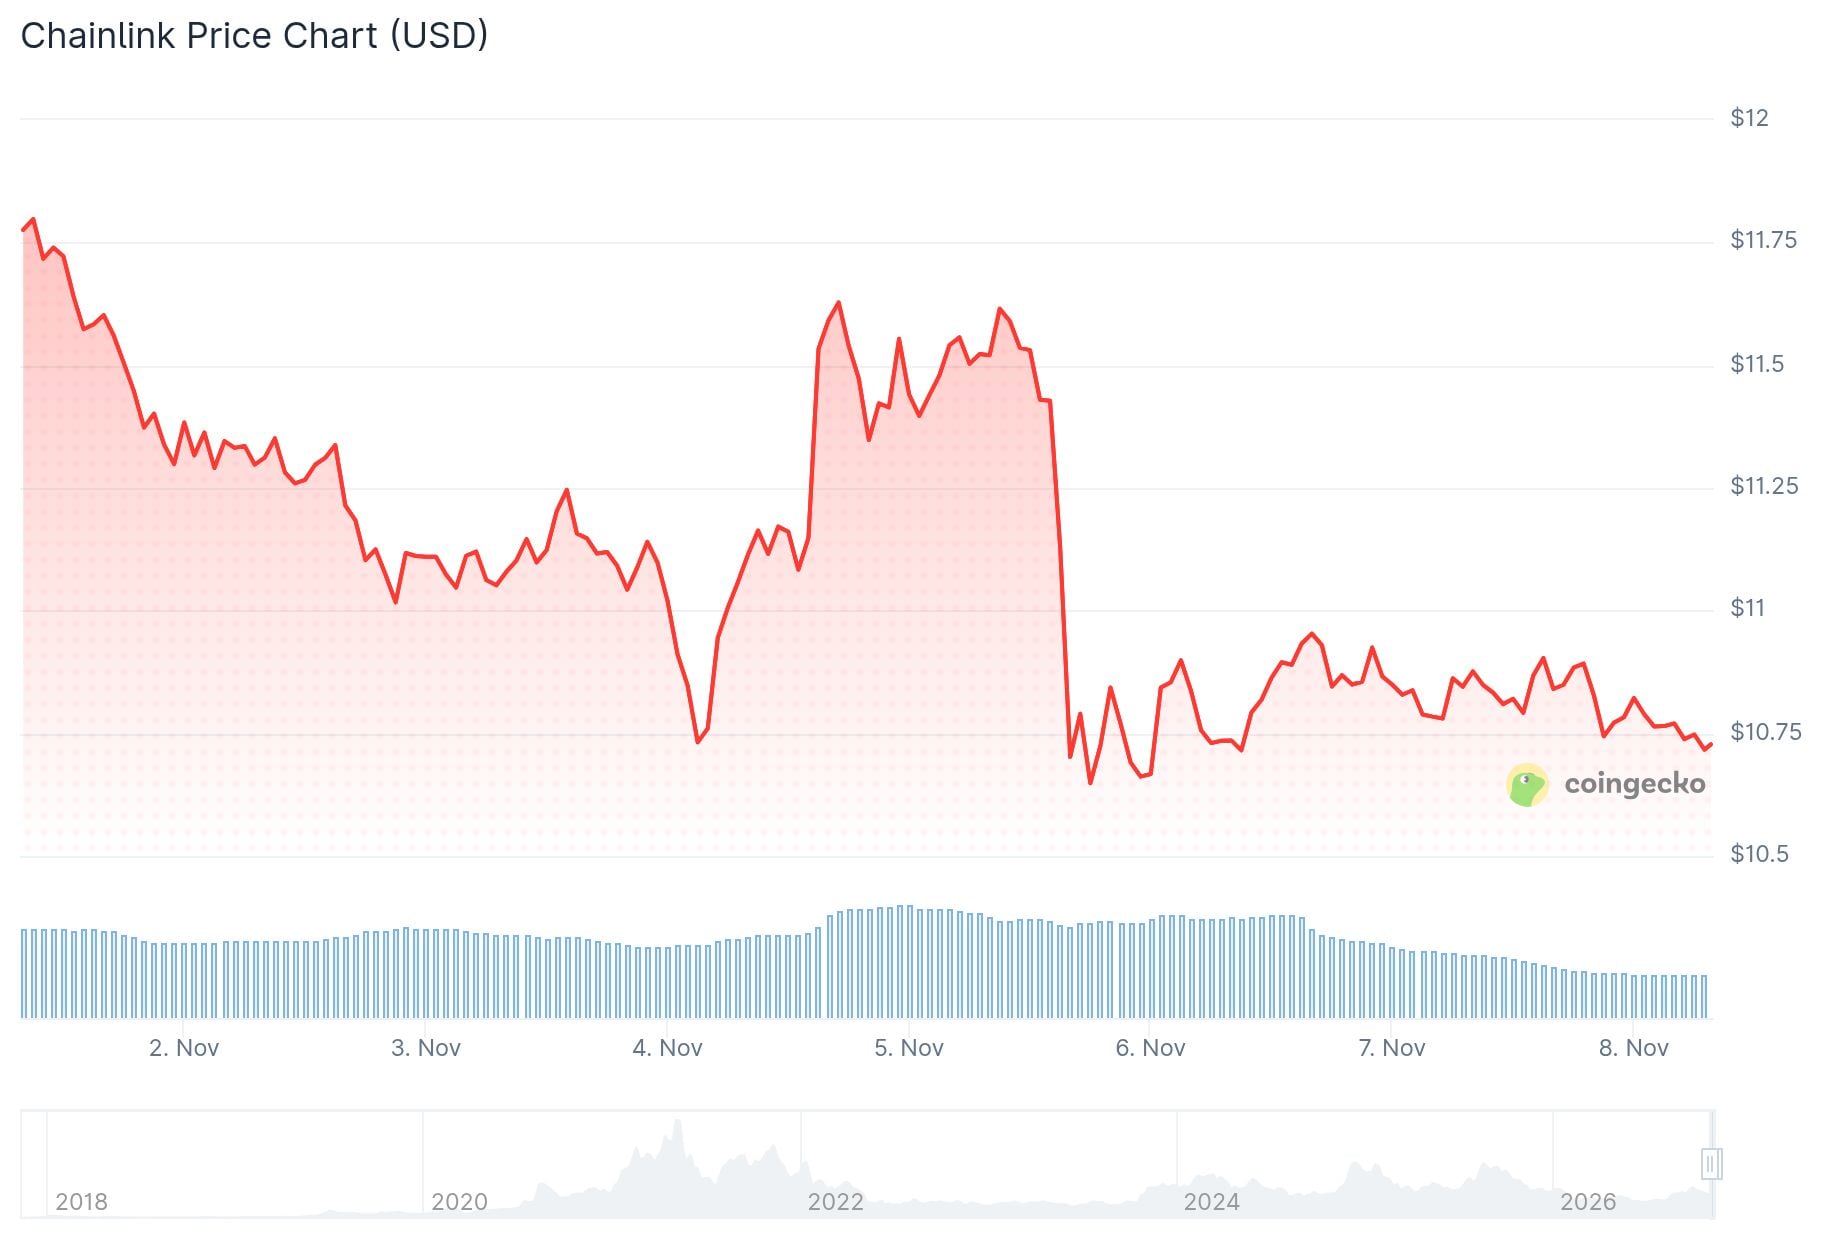
Chainlink (LINK) is trading near $10.85 after a quiet stretch for the broader crypto market. The token has been testing a narrow range, and traders are watching how it behaves around $11. At the same time, on-chain data has pulled attention toward one large holder.
On-chain tracker Onchain Lens reported that a whale withdrew another 16,900 LINK from Binance. The tokens, worth about $181,640, went to a multisignature wallet. This was the latest move in a short series of transfers.
WHALE ACCUMULATES $612.55K IN LINK FROM BINANCE
A whale withdrew another 16.9K $LINK (~$181.64K) from Binance to their multisig wallet.
Total over 18 hours: 57K $LINK (~$612.55K) across four transactions. pic.twitter.com/5tnw2Mk43T
— Onchain Lens (@OnchainLens) November 7, 2026
Across four transactions in 18 hours, the wallet has taken out 57,000 LINK. That amount is worth about $612,550. All of it left the exchange and moved into private custody.
What the Whale Withdrawals Show
Tokens held on an exchange can be sold quickly. Tokens in a private wallet are not as easy to trade. For that reason, traders often watch large exchange outflows.
The data does not show the holder’s intent, though. The withdrawals could point to long-term holding. They could also be a move for security or another reason. More wallet activity would be needed to know which one it is.
If the wallet keeps pulling tokens, the pattern would look more like steady accumulation. If tokens return to an exchange, that view would change. Both outcomes are being tracked by on-chain watchers.

On the daily chart, LINK is testing the $10.70 to $11.00 zone. That area acted as resistance during the recent recovery and now serves as support. The price is also below its shorter-term moving averages.
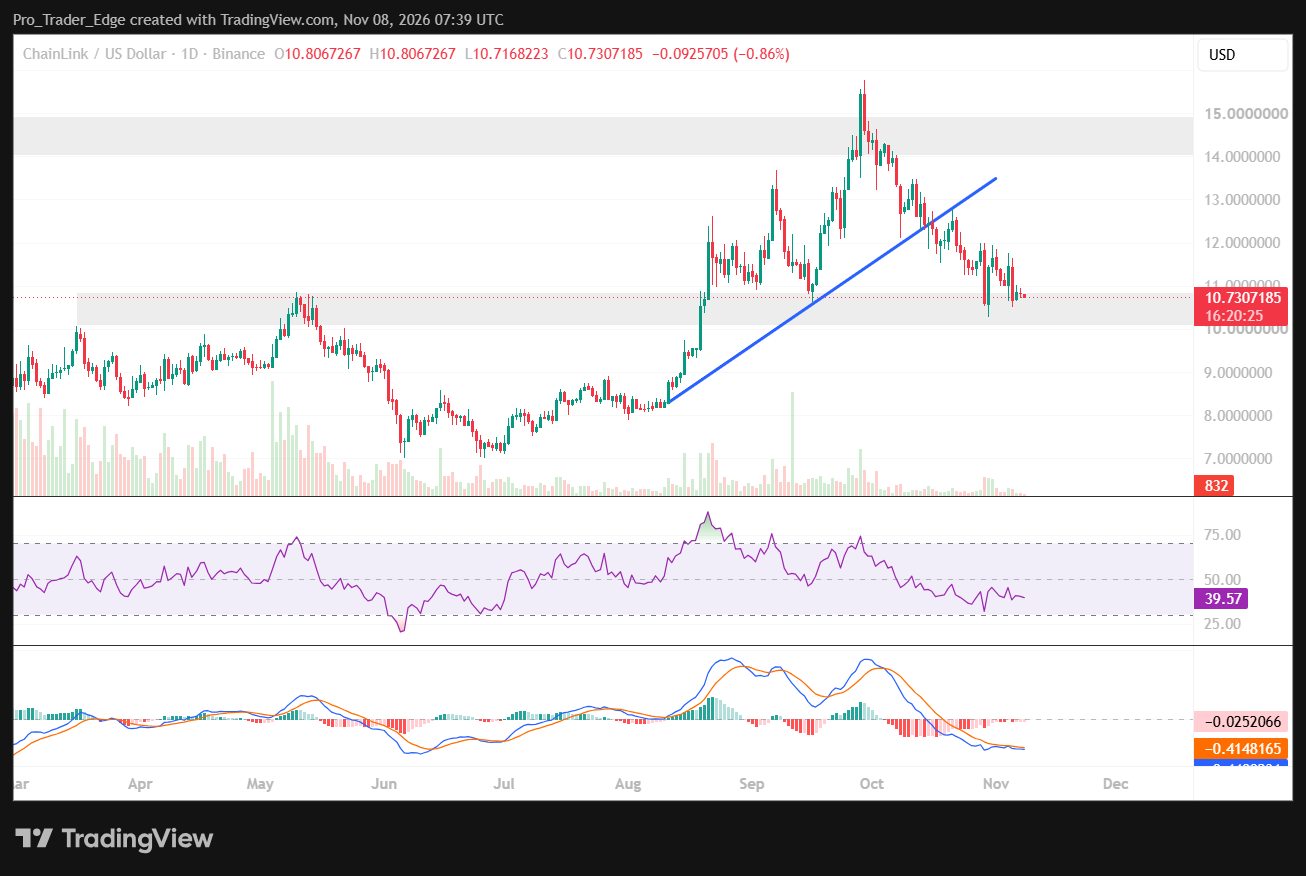
The nearest support is $10.71, and resistance sits at $10.97 to $11.00. A drop under support would put $10.35 in view. A move above $11.00 would bring $11.69 into focus.
The Relative Strength Index (RSI) is near 40. That reading shows weak momentum, with neither buyers nor sellers in clear control. It sits below the neutral mark of 50.
Chart data points to a wider range if buyers take over. A hold above support could open a path toward $11.45 to $11.85. A stronger move could then lead to the $12.00 to $13.00 area.
On the downside, a clean break under $10.70 would weaken the chart. The next major demand zone sits between $7.50 and $8.00. That area has been marked as the next big support on the chart.
Analysts Weigh In on LINK’s Next Move
Analyst Investor Jordan pointed to a possible double bottom on the LINK chart. This pattern forms when price tests the same low twice and then stops falling. He said it suggests selling pressure is easing.
From that pattern, Investor Jordan sees LINK rebounding toward $15. From $10.85, that would be a gain of about 38%. He added that the pattern needs strong buying to be confirmed.
Investor Jordan also noted that LINK has held onto gains better than many coins since the summer. A break of the support line would cancel the setup and the expected bounce.
Michaël van de Poppe offered a view based on timing. He said LINK has fallen for nearly 1.5 months since peaking in September. He expects many traders to look for more downside.
This is a super interesting spot for $LINK.
It's been falling for nearly 1.5 months, since it peaked in September.
Expectations are that we'll continue to fall, but I honestly think that we'll be bottoming out within these weeks or have bottomed already.
That's where you'd… pic.twitter.com/wi6kd1Ub7J
— Michaël van de Poppe (@CryptoMichNL) November 7, 2026
Van de Poppe said he thinks LINK will bottom out within the next few weeks, or may have already done so. He described that kind of zone as the place where traders would look to accumulate assets like LINK.
Both analysts are looking at the same price area from different angles. One is using a chart pattern, and the other is using the length of the decline. Neither says the move is confirmed yet.
Chainlink has also been in the news for its work in Asia-Pacific. The project recently expanded its equities data streams for the region. That update came out in the same period as the whale activity.
For now, LINK is holding above $10.71 while the whale wallet remains the main on-chain story. The most recent data shows LINK near $10.85, with $11.00 as the first level buyers need to clear.


