






TLDR
- Bitcoin fell to about $73,761 on Sunday, its lowest level since August, before bouncing above $75,000.
- More than $1 billion in crypto positions were liquidated in 24 hours, with $913 million coming from longs.
- Bitcoin is stuck between 200-day average support near $73,150 and 100-day average resistance at $77,430.
- U.S. spot Bitcoin ETFs saw $412 million in net outflows on November 6.
- Analysts CryptoBullet and Colin Talks Crypto both point to the 200-day moving average as a key level.
Bitcoin dropped to about $73,761 late Sunday, its lowest point since August. The price then recovered to trade above $75,000, according to CoinDesk data. Ether also fell below $2,100 before bouncing to $2,144.
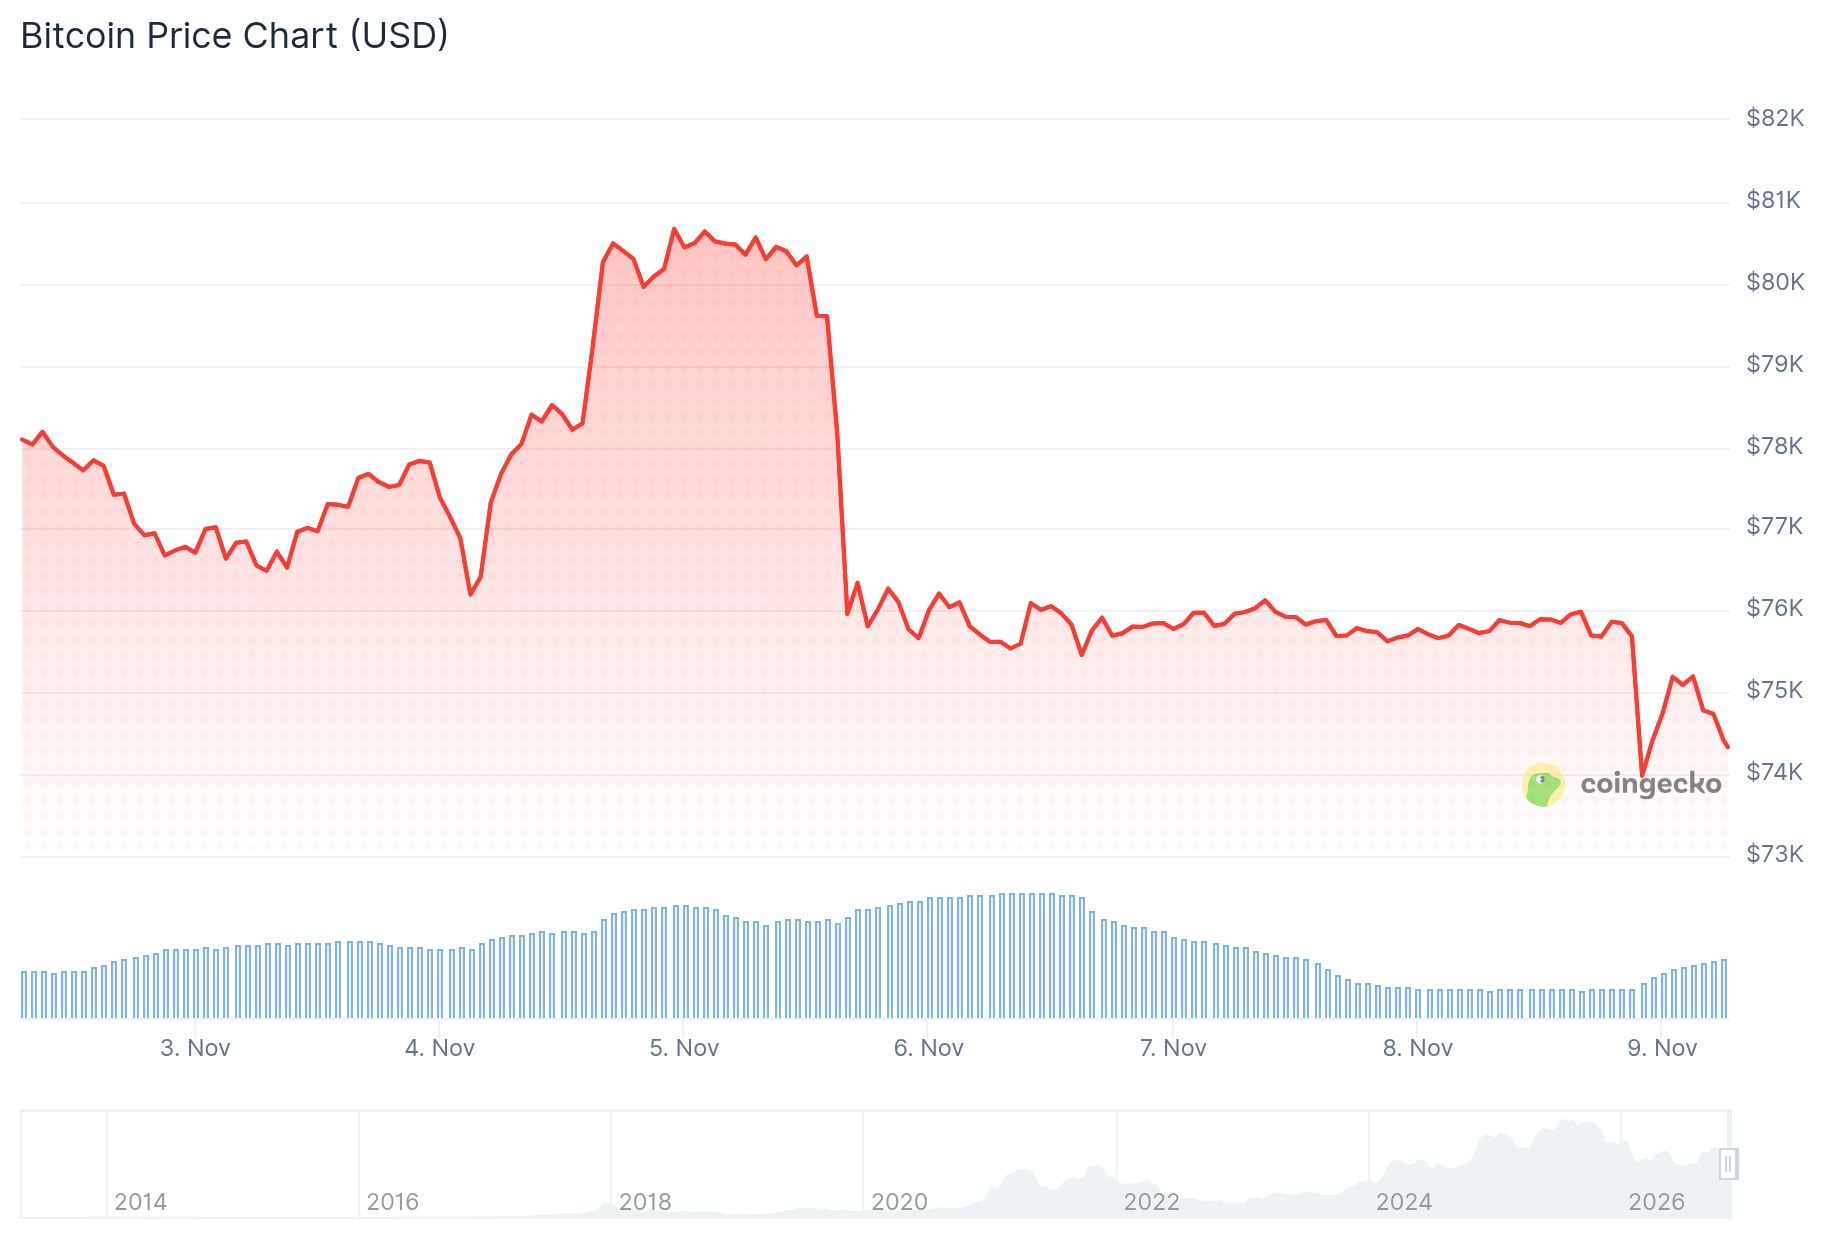
The sharp swings came over a weekend when crypto was the only open major market. Traders reacted to two headlines that pushed investors toward safer assets. One involved Nvidia’s CEO, and the other involved stalled talks with Iran.
Liquidations Hit Leveraged Traders
The volatility set off forced selling in futures markets. CoinGlass data shows more than $1 billion in positions were liquidated in 24 hours. Most of that happened in the last six hours or so.
BREAKING: $1,000,000,000 liquidated from the crypto market in the past 10 minutes.$BTC falls under $74,000$ETH falls under $2,125$XRP falls under $1.10 $SOL falls under $90 pic.twitter.com/hIZhzQFJJe
— Watcher.Guru (@WatcherGuru) November 8, 2026
Long traders, who bet on rising prices, made up $913 million of the total. Ether saw $448 million in liquidations, nearly double Bitcoin’s $272 million. The largest single liquidation was an ETH order worth $48 million.
Nvidia’s board opened an independent investigation after reports that CEO Jensen Huang had a relationship with Alice Huang. U.S. intelligence agencies believe she was passing information to Beijing. Huang admitted the affair in a message to employees and apologized.
Nvidia said it has no reason to believe national security or company secrets were compromised. Outside independent counsel is helping the board review all available information.

Crypto traders priced in the news quickly. NVDAX, the tokenized Nvidia stock on xStock, fell 3.55% to $180.42 in 24 hours. The real stock closed at $186.64 on Friday, so the discount suggests traders expect a lower open on Monday.
The Nasdaq fell nearly 5% last week, extending a four-week losing streak. Separately, Secretary of State Marco Rubio called Iran’s demands “outrageous” and said talks made no progress. Since the Iran war began in March, Bitcoin has more often than not declined when oil prices rallied.
Other data shows how the broader market looked before the drop. Bitcoin traded near $75,982 on Sunday and was down about 8% over the past month. The Crypto Fear and Greed Index read 28 out of 100, which signals fear.
ETF flows also leaned negative. According to SoSoValue, U.S. spot Bitcoin ETFs recorded $412 million in net outflows on November 6. Total net withdrawals reached about $1.28 billion from November 2 to 6.
Ethereum spot ETFs lost $93.19 million on November 6. BlackRock’s Staked ETH ETF, ETHB, still led daily inflows with $1.15 million.
Analyst CryptoBullet said Bitcoin reached the 200-day moving average as expected. He described the two-month correction as nearing its end. He added that anyone who missed the August rally may see this dip as a chance to buy.
$BTC 1D update 🧯
So we reached the 200-Day MA as expected ✅ 😉
The 2-month correction is coming to an end. If you think we're in a new Bull Market (which is very likely), then this dip is your chance to get in if the August pump caught you off guard.
Cheers 🥂 https://t.co/vBiezLTCyd pic.twitter.com/Vm0hnyPO3v
— CryptoBullet (@CryptoBullet1) November 8, 2026
Analyst Colin Talks Crypto said Bitcoin is repeating the last bear market pattern. After a big pump off cycle lows, the price dropped to tag the 200-day average, as it did in March 2023. He did not rule out lower prices in the very short term given weak stocks.
So far, $BTC is playing out exactly like it did last bear market.
After a big pump off the cycle lows, it dropped to tag the 200-day MA, just like it did back in March 2023.
Will it go lower? Based on the ugliness of stocks at the moment, I would not rule that out in the very… pic.twitter.com/qKnwJjU5WF
— 𝙲𝚘𝚕𝚒𝚗 𝚃𝚊𝚕𝚔𝚜 𝙲𝚛𝚢𝚙𝚝𝚘 (@ColinTCrypto) November 9, 2026
Key Levels Traders Are Watching
On the daily chart, Bitcoin sits between the 200-day average support near $73,150 and the 100-day average resistance at $77,430. The bounce to $75,000 had already stalled at the time of CoinDesk’s report.
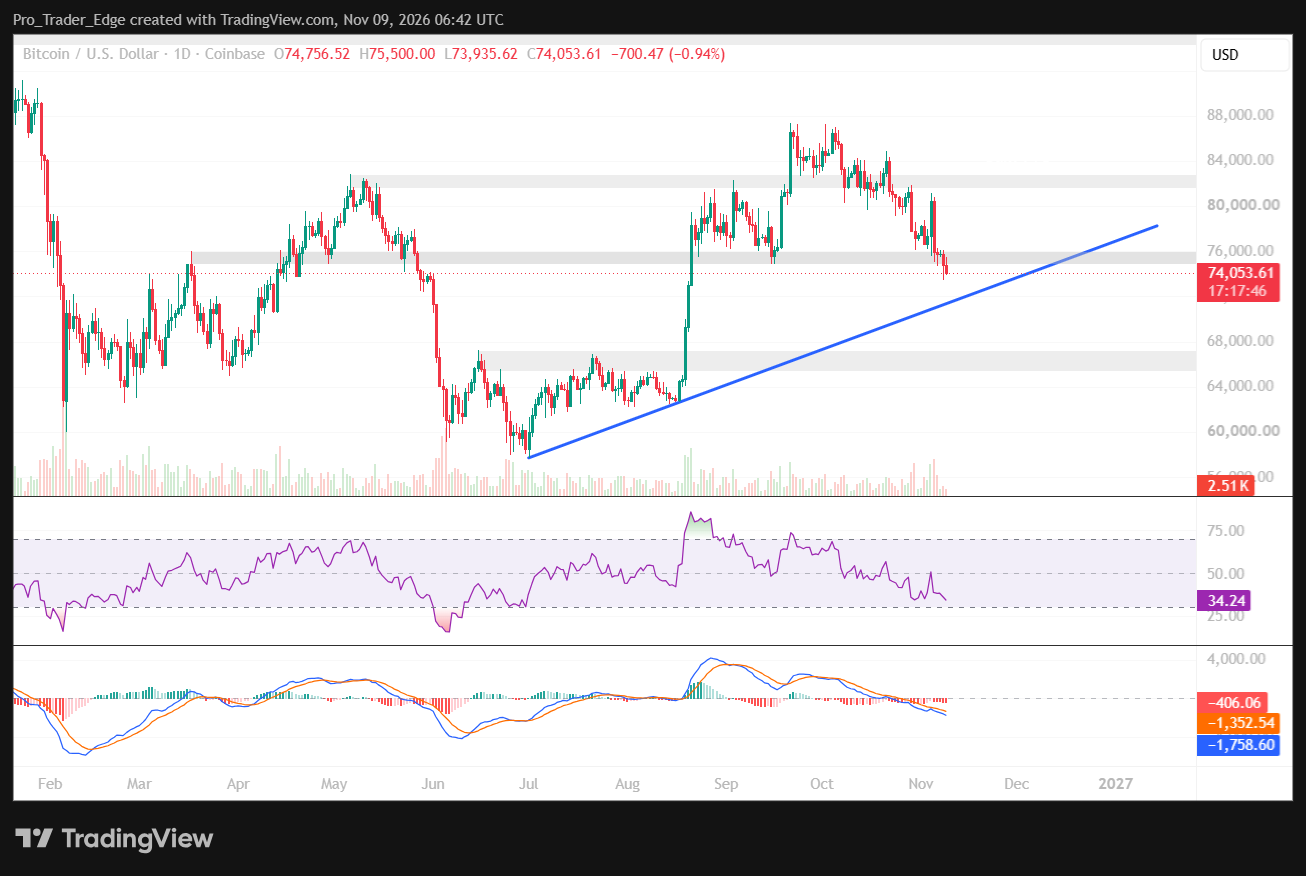
Four-hour chart data shows the relative strength index at 40, below the neutral 50 level. The MACD histogram turned positive at 52.47 after a run of negative readings.
A four-hour close above $76,000 would put resistance at $78,000 in focus. A move past $78,000 could bring $80,000 into view, about 5.26% higher. Another rejection near $76,000 could send the price back toward $75,000, and a break below it would expose $70,000.
Derivatives activity cooled somewhat. Bitcoin derivatives trading volume fell 40.04% to $16.52 billion, while open interest rose 0.51% to $51.60 billion.
Bitcoin is also close to ending its fifth red weekly candle in a row. Colin Talks Crypto said stocks could bounce around the middle of next week, which could lift Bitcoin with them.
Traditional markets open Monday, and the Nvidia investigation and Iran talks remain unresolved.


