






TLDR
- Solana (SOL) traded near $82.88 on November 12, down 0.36%.
- SOL is about 33% below its late-September high near $124 after breaking a multi-month trendline.
- US spot Solana ETFs posted a fifth straight day of outflows, totaling about $53.3 million.
- Seven-day DEX volume fell 23.79%, and perpetual futures volume fell 30.89%.
- Key support sits at $77 to $82, while resistance runs from $90 to $98.
Solana (SOL) traded near $82.88 on Thursday, November 12, down 0.36% on the day. The intraday low came in at $82.38. The token has been trying to recover after a recent breakdown.
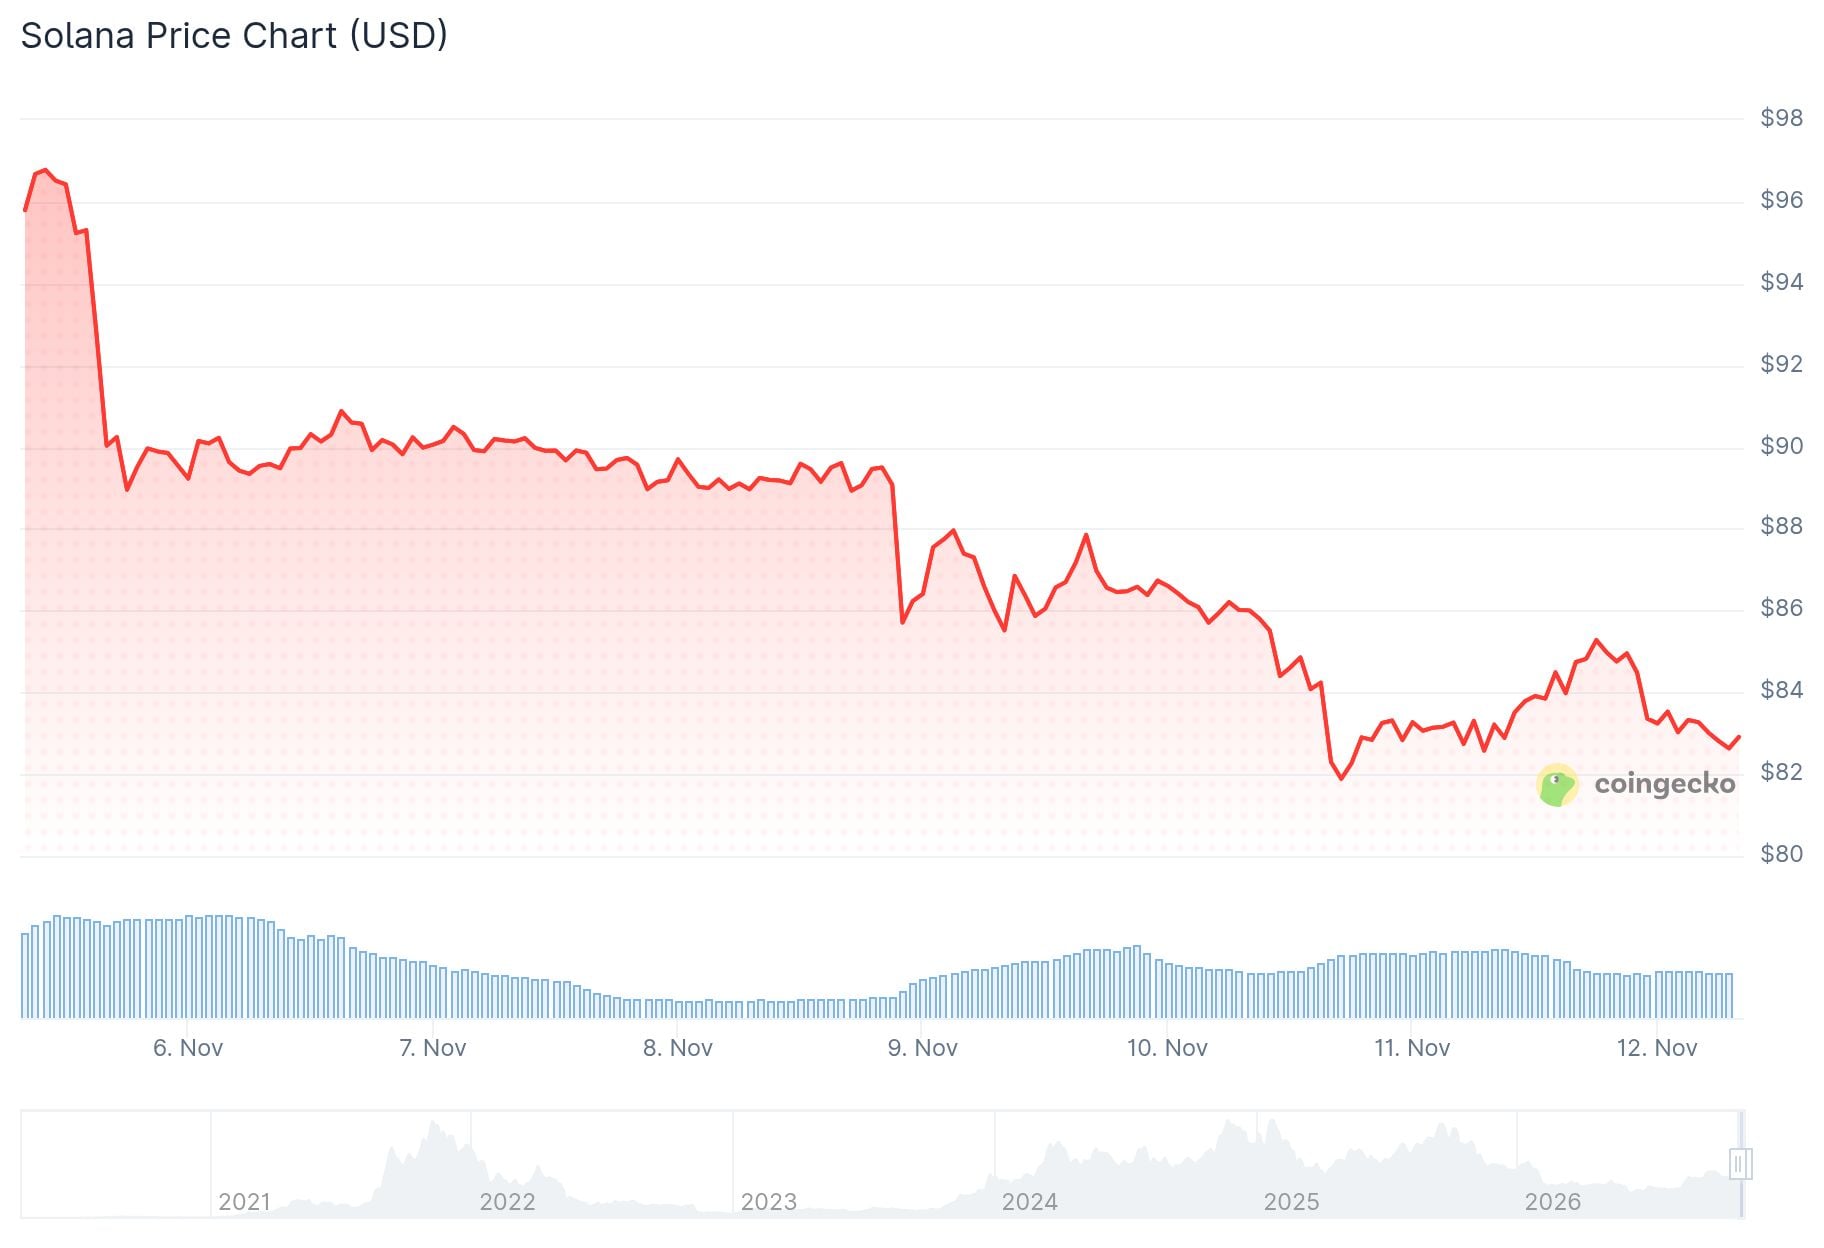
SOL has fallen about 33% from its late-September high near $124. It slipped below a multi-month ascending trendline in early November. That move ended a run of higher lows.
The trendline had offered support near $90 to $92. It formed after SOL made a low near $60 in June and climbed through July, August and September.
Analyst Ted Pillows said on X that downside liquidity on SOL has been swept. He pointed to two major liquidity zones near $90 and $100. He added that Solana looks set for a relief bounce, much like Ethereum.
$SOL downside liquidity has been swept.
Now, there are 2 major liquidity zones around $90 and $100.
Just like ETH, Solana also looks good for a relief bounce here. pic.twitter.com/kMrYilX9qm
— Ted (@TedPillows) November 11, 2026
ETF Outflows Reach Five Straight Sessions
US spot Solana ETFs recorded about $5.9 million in provisional net outflows on November 11, according to CryptoETF.today. It was the fifth straight session of withdrawals. The figure may change as more funds report.
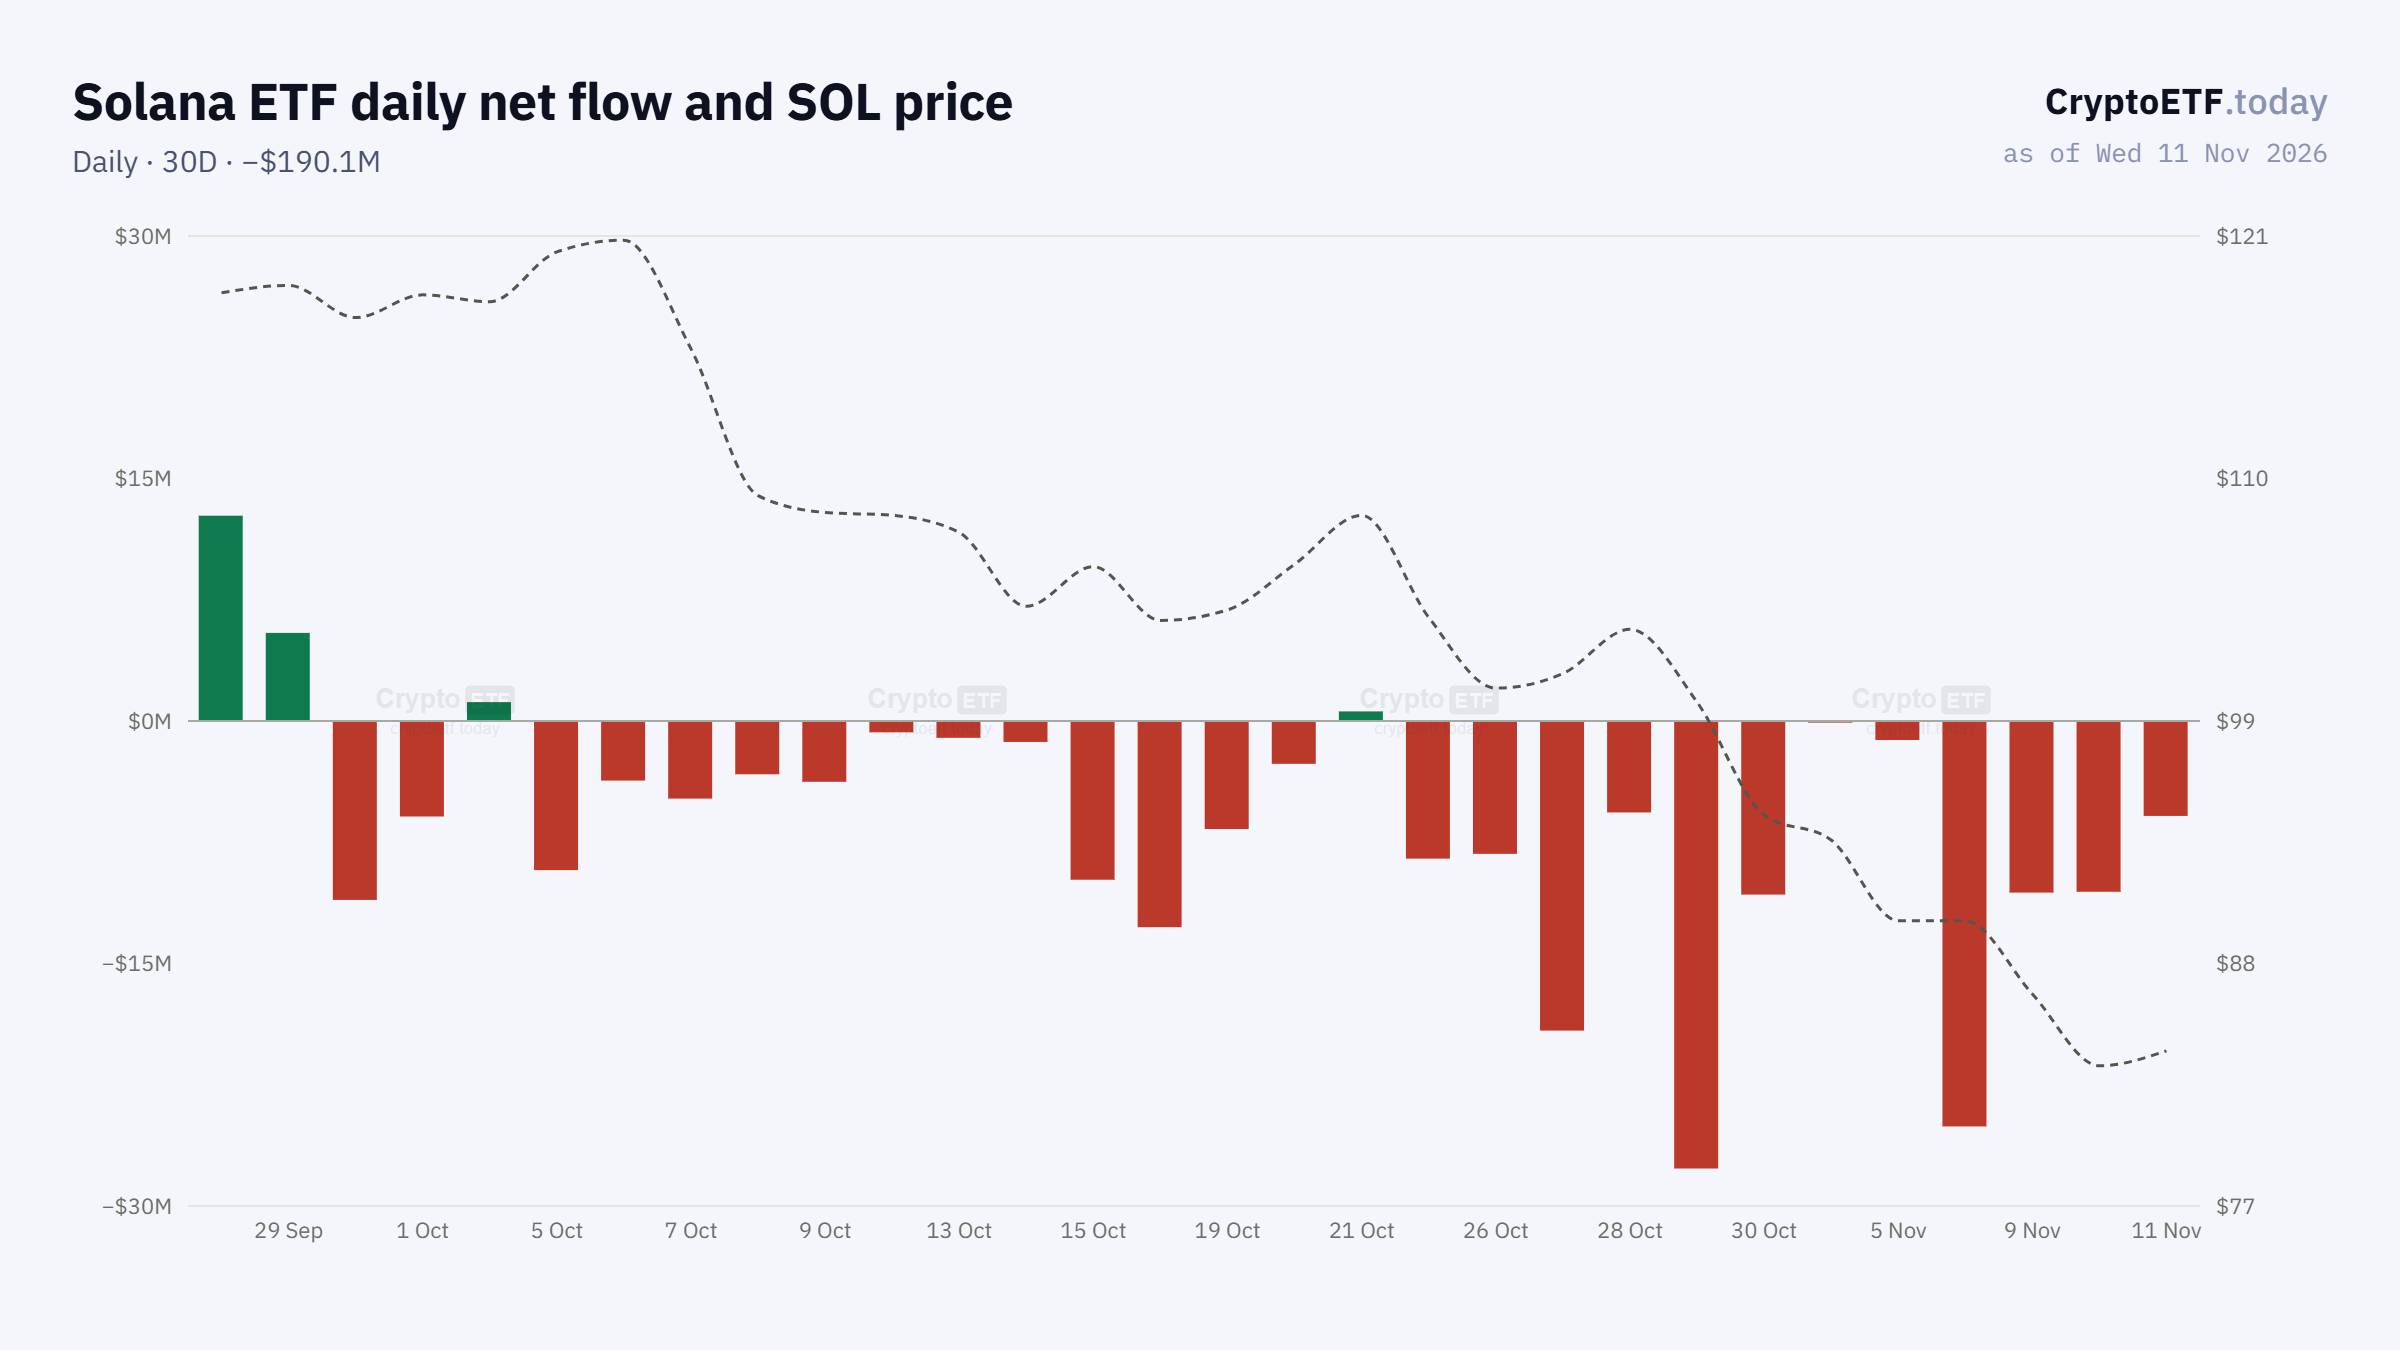
Fidelity’s FSOL accounted for $3.8 million of the outflows. Morgan Stanley’s MSOL saw another $2.1 million leave. Together they made up the full day’s total.

The five-day streak has pulled out about $53.3 million in total. Even so, cumulative ETF inflows remain positive at about $1.42 billion. Total fund assets are near $1.2 billion.
The tracker estimates the average ETF entry price at about $115.51. That is well above the current SOL price of roughly $83. It is a cost-basis estimate and does not show whether holders plan to sell.
On-Chain Data, Adoption News and Key Price Levels
DefiLlama data for November 12 shows about 106.27 million transactions on Solana over 24 hours. The network had 2.65 million active addresses. DEX volume reached about $1.53 billion.
Total value locked in Solana DeFi stands near $5.03 billion. Seven-day DEX volume fell 23.79%, while perpetual futures volume dropped 30.89%. Stablecoin market cap also fell 3.39% over seven days, to about $13.96 billion.
On November 10, Helius announced Solana Privacy Rings, a permissionless privacy protocol. It supports encrypted balances, private transfers and programmable privacy features for DeFi apps.
Samsung launched USDC functionality in Samsung Wallet on November 5. Eligible Galaxy users in the United States can buy, hold, send and receive USDC on Solana. The Solana Foundation’s October report also cited about $5 billion in real-world asset value.
On the chart, the first resistance zone sits between $90 and $98. The broken trendline and an earlier consolidation area overlap there. A move above $98 would open the way toward $105 to $110.
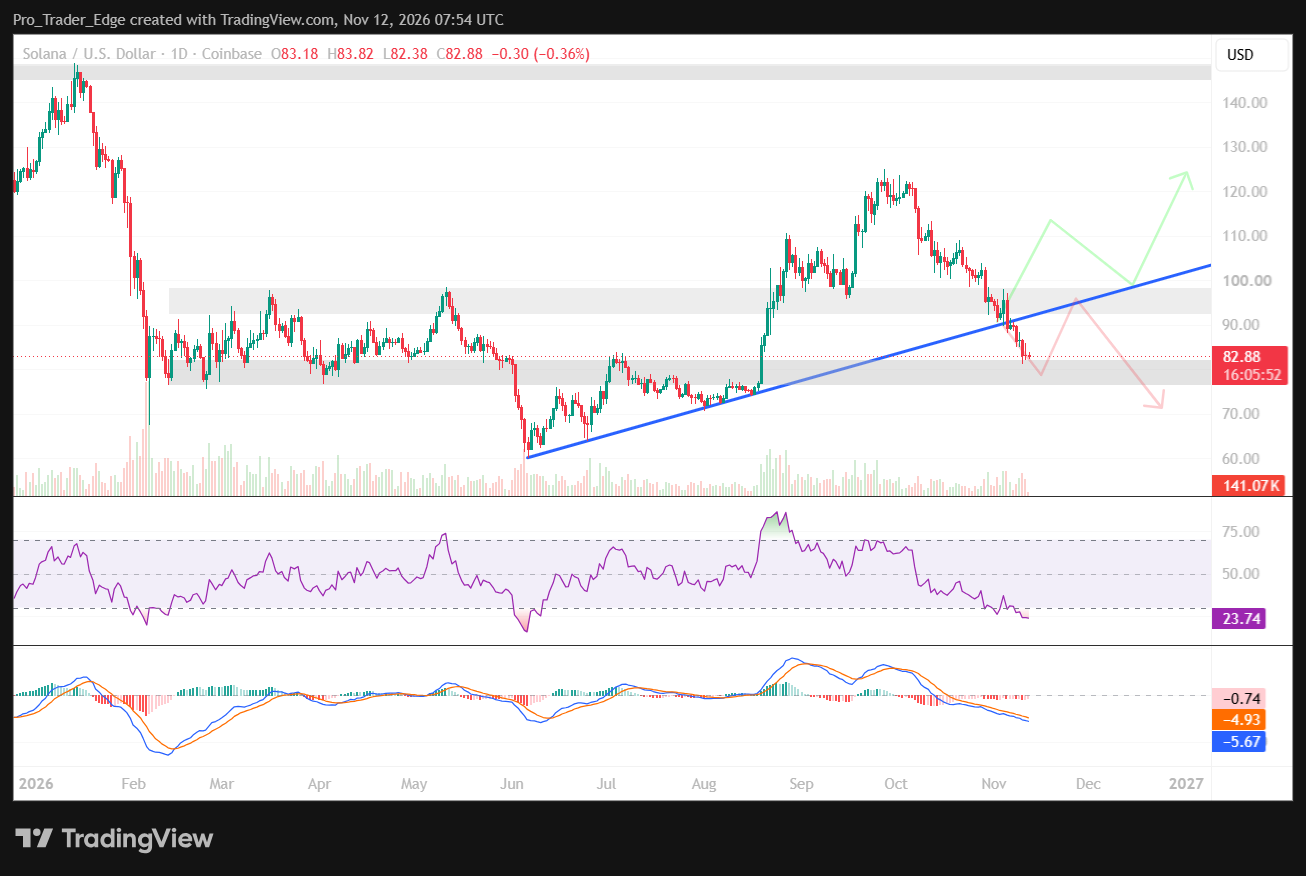
Support sits in the $77 to $82 zone, which shaped price action in June and July. Analyst il Capo wrote on X that SOL is reaching support. A bounce from that area could first target $88 to $90.
$SOL reaching support. https://t.co/UHJOHDqW0O pic.twitter.com/5FaKKc6UKZ
— il Capo (@CryptoCapo_) November 10, 2026
A daily close below $77 would put the $70 to $75 area in view. The June low near $60 sits below that. Traders are also watching ETF flows and stablecoin supply.
Momentum indicators remain weak. The Relative Strength Index is at 23.74, which is oversold territory. The MACD line is at -5.67, below its signal line at -4.93, and the histogram reads -0.74.


