






TLDR
- Ethereum fell below $2,000 on November 13 and traded near $1,909, down 5.35% on the day.
- More than $1.3 billion in crypto futures positions were liquidated over 24 hours.
- US spot Ethereum ETFs saw about $523.9 million in outflows over five completed sessions.
- ETH is testing a support area between $1,850 and $1,970.
- The RSI is at 23.86 and the MACD remains bearish.
Ethereum (ETH) fell below $2,000 on Friday, November 13, and traded near $1,909. The price dropped 5.35% during the daily session and touched an intraday low of $1,899.13.
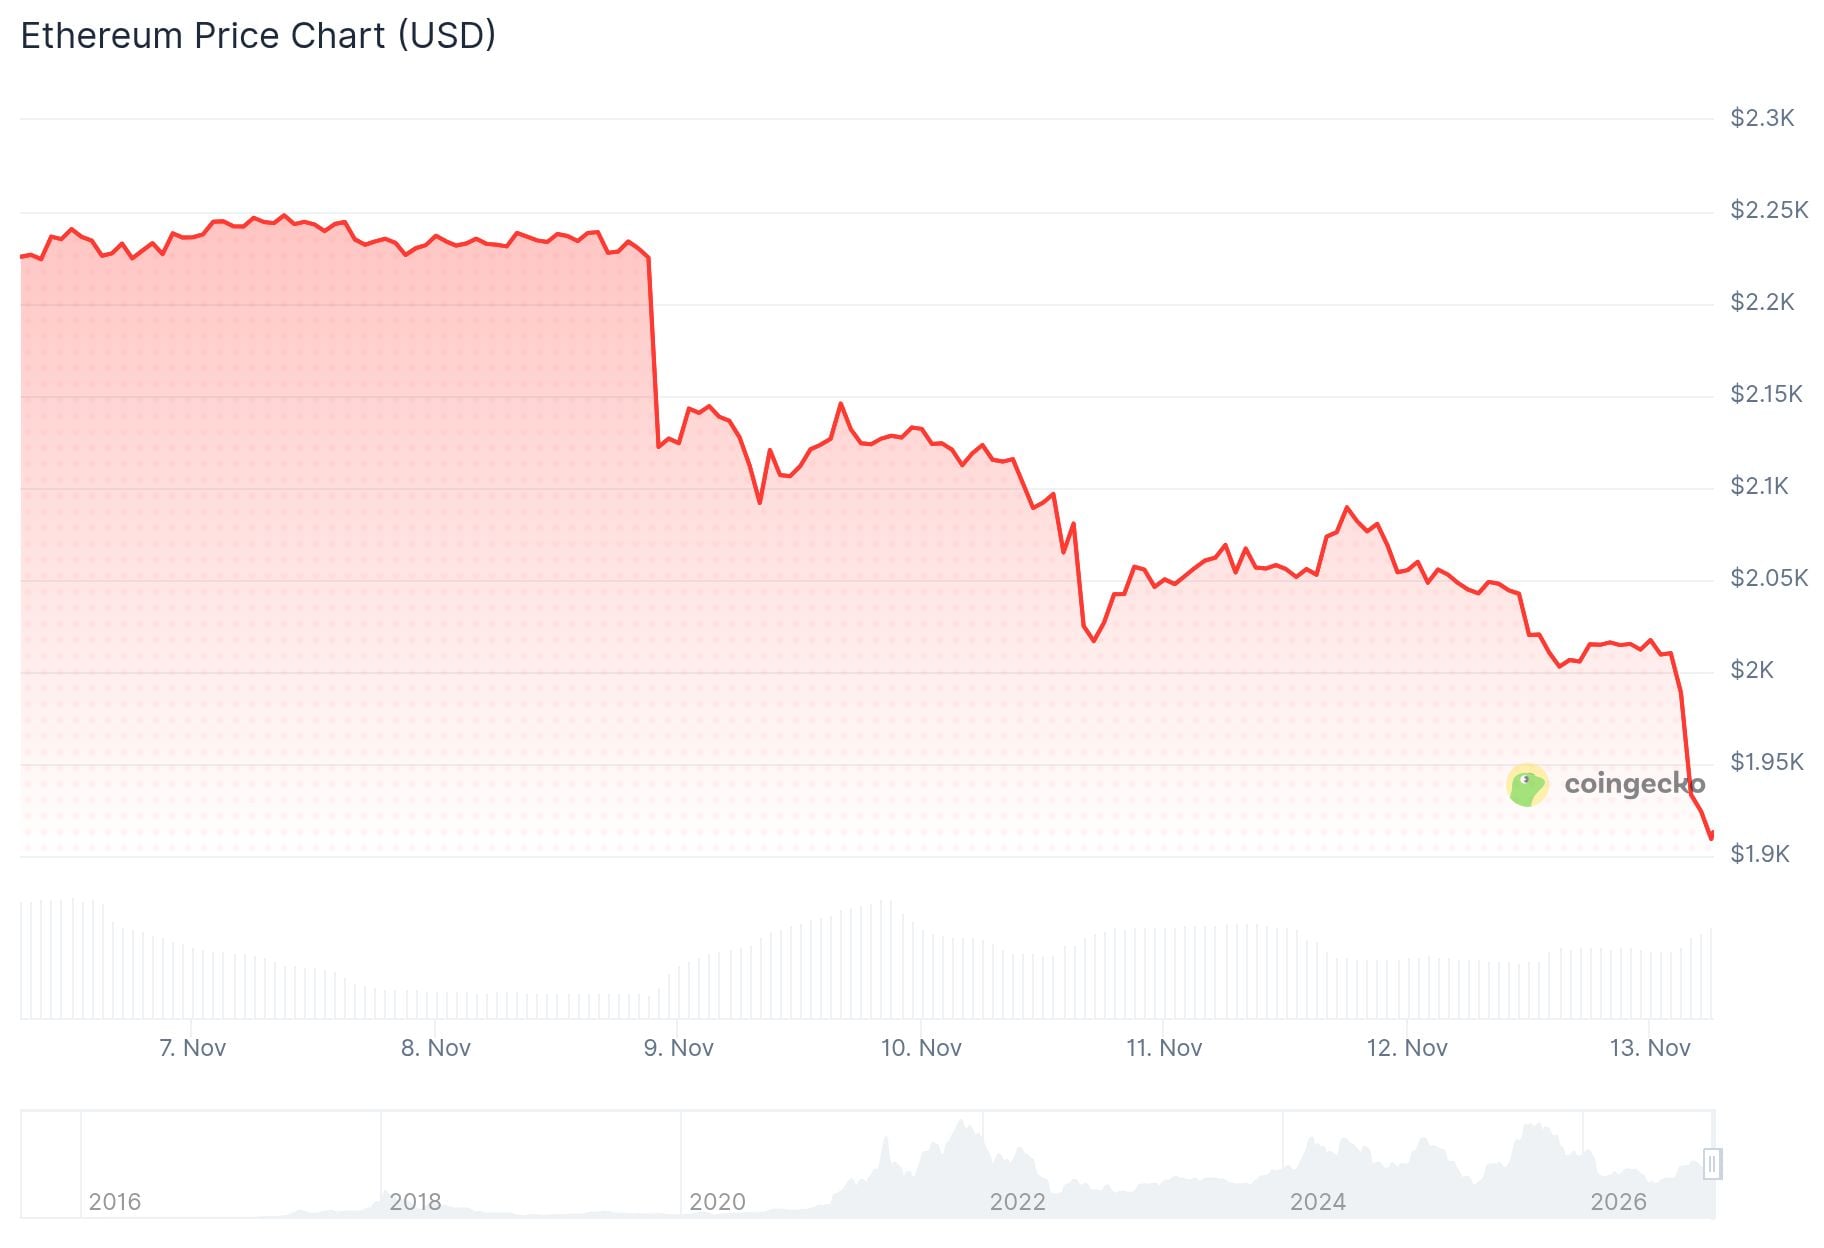
The move came as Bitcoin slipped under $70,000. CoinDesk reported that more than $1.3 billion in crypto futures positions were liquidated over 24 hours, including about $677 million in Bitcoin.
Lookonchain tracked a whale that sold 6,532 ETH, worth about $13.62 million, at an average price of $2,085. The platform said the sale locked in a loss of about $3.1 million on an earlier purchase.
Wallets linked to the Ethereum Foundation also sold ETH for stablecoins in November, according to Crypto.news. That report came alongside the whale sale tracked by Lookonchain.
Analyst CryptoBullet took a longer view in a November 11 post. The analyst said a multi-year accumulation range between $1,000 and $5,000 would resolve to the upside between 2027 and 2029, and that buying below the 0.618 Fibonacci level is simple.
Scared to buy $ETH right now? Zoom out!
See this multi-year accumulation range between $1-5k? That thing will be resolved to the upside in 2027-2029 🚀
Buying everything below the 0.618 Fib is simple and brilliant pic.twitter.com/VU9TBV63UO
— CryptoBullet (@CryptoBullet1) November 11, 2026
Ethereum ETF Outflows and On-Chain Metrics
US spot Ethereum ETFs recorded net withdrawals of $144.8 million on November 11, according to Farside Investors. That followed $184.6 million in outflows on November 9.

BlackRock’s ETHA made up $129.8 million of the November 11 redemptions. Preliminary figures for November 12 showed another $8 million in net outflows, though several major funds had not yet reported.
Across the five completed sessions from November 5 to November 11, outflows totaled about $523.9 million. Cumulative net inflows since launch still stand near $11.6 billion, based on provisional data.
DefiLlama’s November 13 snapshot showed about 2 million Ethereum transactions and 582,817 active addresses over 24 hours. Decentralized exchange volume reached $1.69 billion.
Total value locked in Ethereum DeFi protocols fell 4.31% to about $39.32 billion in 24 hours. Seven-day DEX volume dropped about 31%.
Stablecoin market capitalization on Ethereum stood near $131.7 billion, down 3.4% over seven days. Part of the TVL decline reflects lower token prices rather than equal capital withdrawals.
Ethereum Chart Levels and Momentum Indicators
Ethereum’s daily chart shows a series of lower highs and lower lows since ETH was rejected near $2,800 in late September. Before that, a trendline from the June low of about $1,510 supported the recovery through July, August and September.
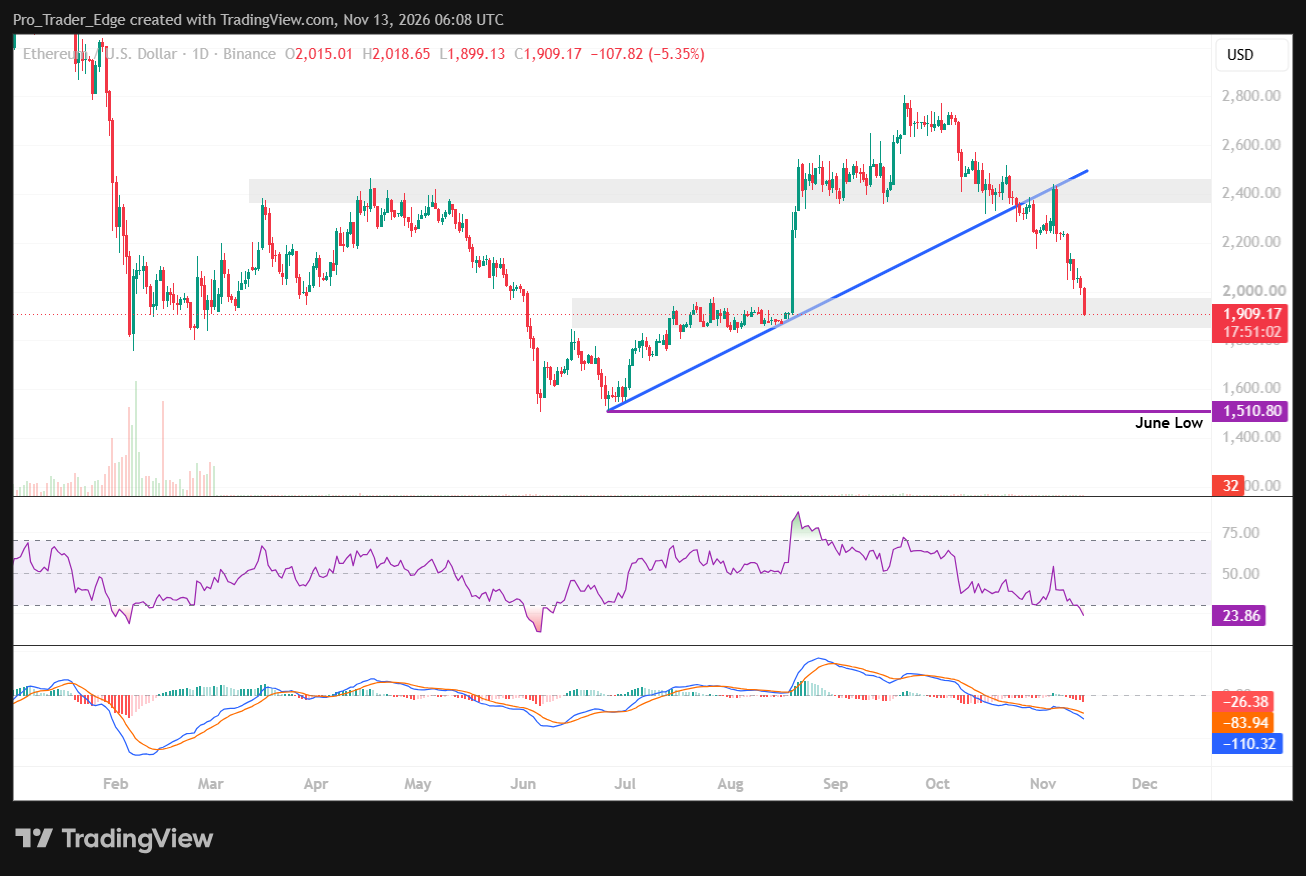
The latest drop pushed ETH below that trendline, which had acted as support near $2,300 to $2,400. A recovery attempt then failed near the $2,400 to $2,450 resistance zone.
Friday’s low placed ETH inside a support area between $1,850 and $1,970, which also influenced price in June, July and August. A daily close below $1,850 would bring $1,700 to $1,750 into view, followed by $1,600 and the June low at $1,510.80.
On the upside, reclaiming $2,000 would be a first step. Further resistance sits at $2,100 to $2,200 and again at $2,350 to $2,450.
The Relative Strength Index sits at 23.86, which is inside oversold territory. The MACD line stands at -110.32, below its signal line at -83.94, with a histogram reading of -26.38.
$ETH daily chart remains ultra bearish.
Yellow fractal -> Long liquidation cluster -> Yellow line
$1,338 would be wild. 👀 pic.twitter.com/GGnbDqF17Y
— Jesse Olson (@JesseOlson) November 13, 2026
Analyst Jesse Olson posted an hour before publication that the ETH daily chart remains ultra bearish. He pointed to a yellow fractal running through a long liquidation cluster and named $1,338 as a possible downside level on that path.


