





TLDR
- SOL traded near $89.62 on Friday, November 6, after falling about 28% from its September high near $124.
- Solana processed about 108.27 million transactions in 24 hours, per DefiLlama.
- US spot Solana ETFs saw $1.18 million in net outflows on November 5, per Coinmico.
- Samsung Wallet now supports USDC on Solana for eligible US Galaxy users.
- SOL’s RSI sits at 30.06, and support is mapped at $88 to $90.
Solana (SOL) traded around $89.62 on Friday, November 6, while its network kept posting heavy usage numbers. The price sits near an ascending trendline that has guided the market since June.
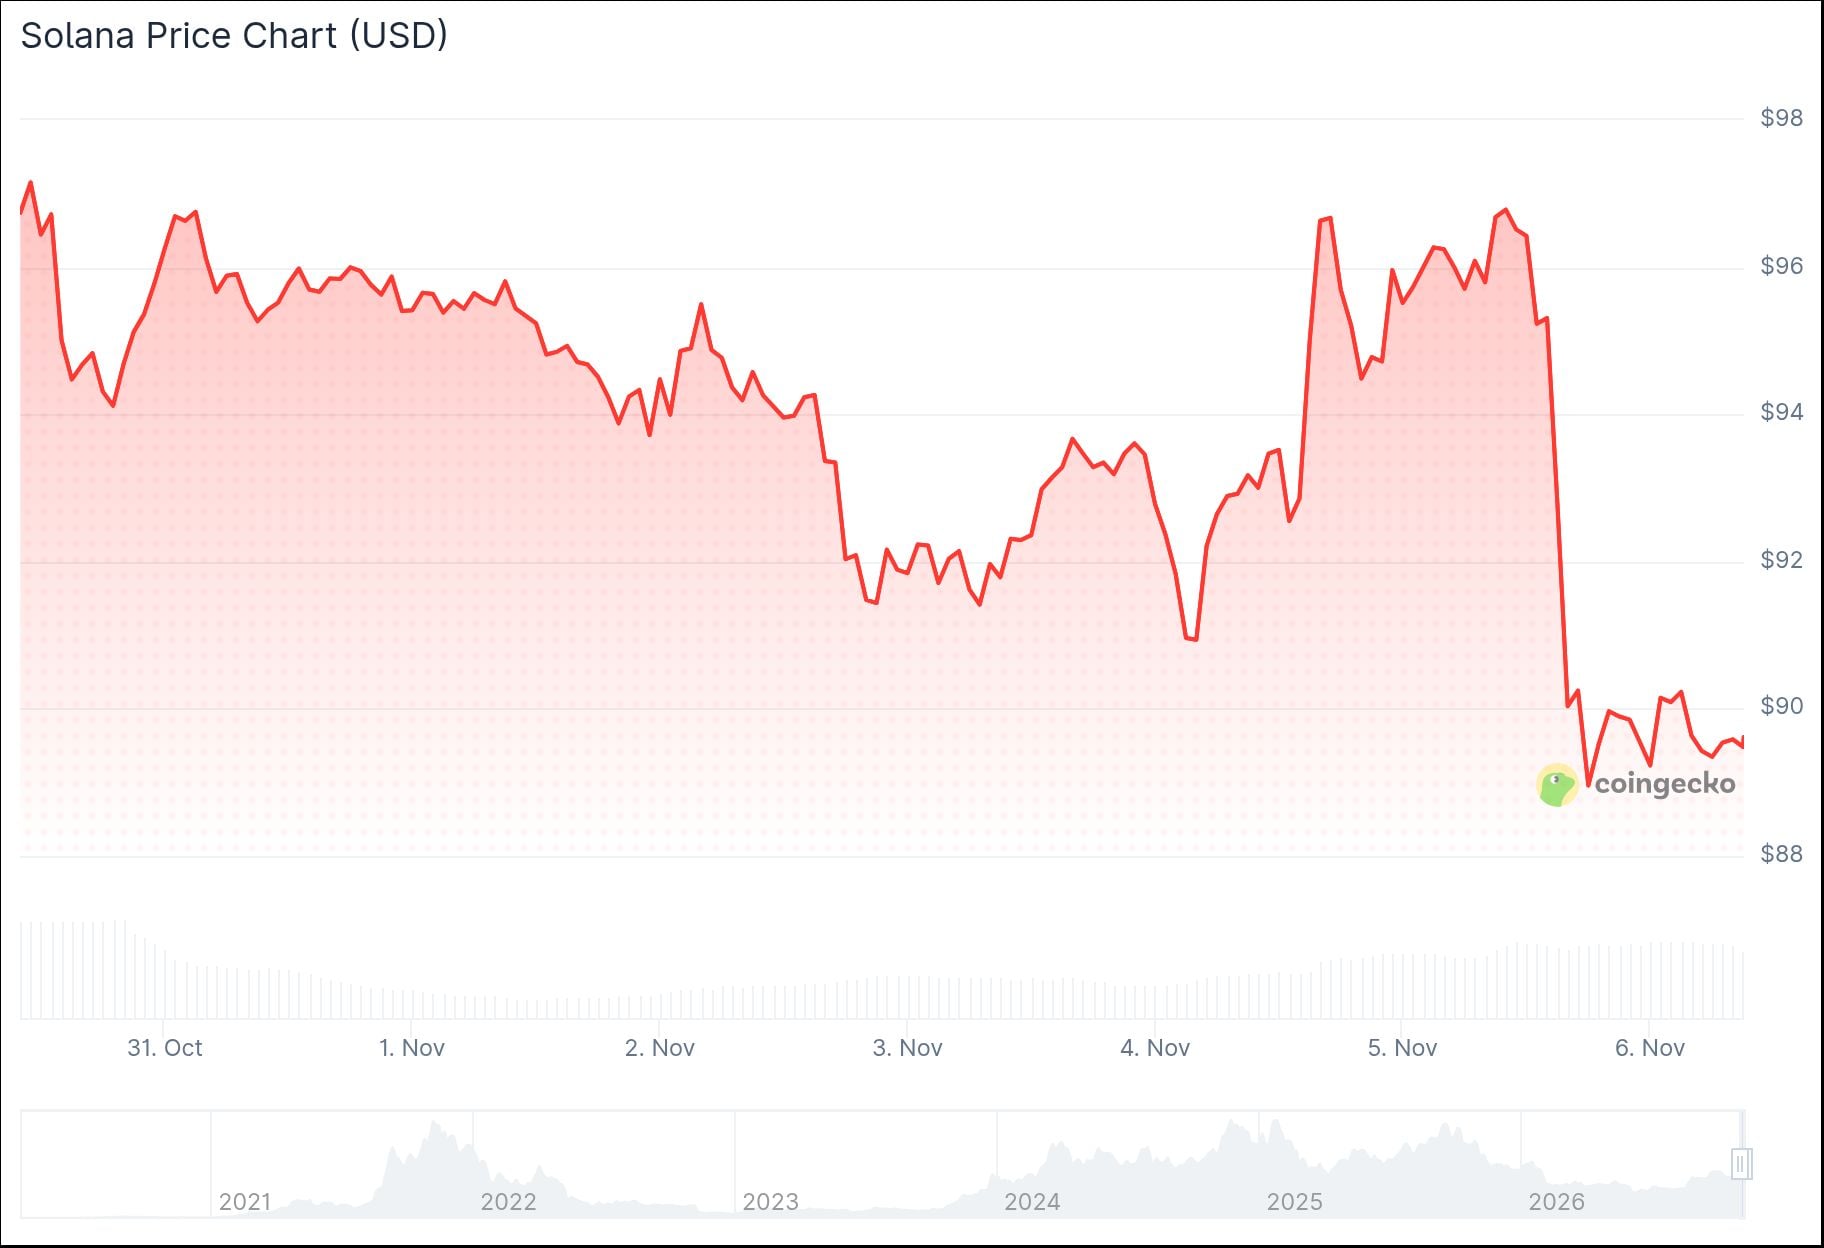
DefiLlama data from November 6 shows Solana processed about 108.27 million transactions in 24 hours. The network also recorded 2.83 million active addresses over the same period.
Decentralized exchange trading volume reached about $2 billion. Total value locked across Solana’s DeFi ecosystem stood near $5.26 billion.
Liquidity Slips While Network Use Holds
Seven-day DEX trading volume fell 10.7%. Stablecoin market capitalization on Solana dropped 2.73% to $14.76 billion.
The decline in DeFi value partly reflects lower crypto prices rather than an equal amount of capital leaving. The network’s activity counts remained high during the same stretch.
On November 5, Solana announced that a stablecoin account went live inside Samsung Wallet. Eligible Galaxy users in the United States can now buy, hold, send and receive USDC on Solana.
Transfers of USDC generate relatively small fees on the network. That means higher stablecoin use does not automatically mean more demand for SOL.

US spot Solana ETFs recorded about $1.18 million in net outflows on November 5, according to Coinmico. Seven-day withdrawals reached $11.92 million.
The tracker also reported about $127.4 million in net outflows over 30 days. Cumulative inflows since launch remain positive at about $1.47 billion.
Total ETF assets stood near $1.33 billion, or about 2.53% of Solana’s market capitalization. Alpha Finance reported a different figure for November 5, at about $800,000 in outflows.
Price Tests the $90 Trendline
SOL fell toward $60 in June, then built the ascending trendline that supported its summer recovery. It rallied to $124 in late September before sellers pushed it back.
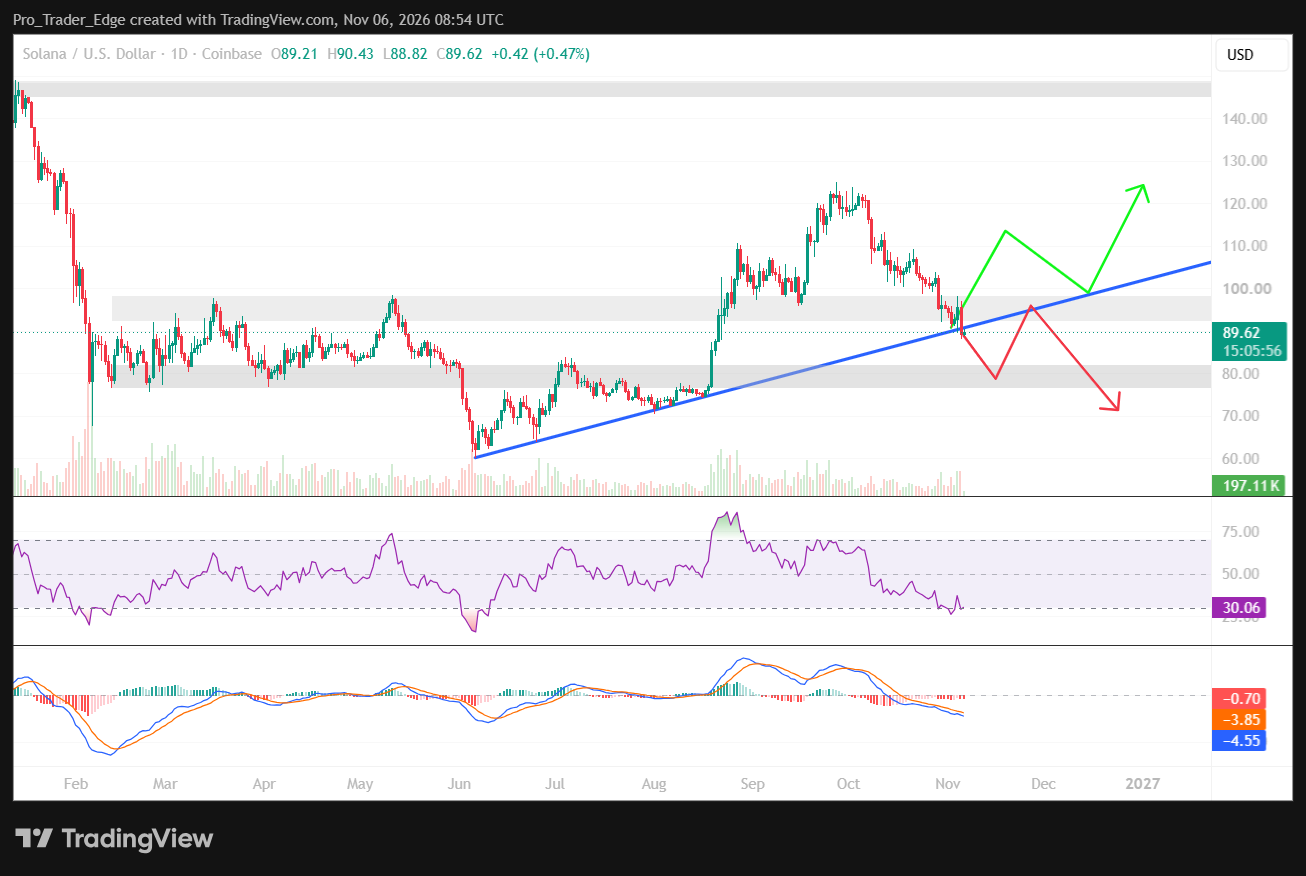
Since that peak, the chart has printed a series of lower highs and lower lows. The drop from the high now stands at about 28%.
Friday’s intraday low was $88.82, which briefly dipped under the trendline before price recovered to $89.62. The daily candle was still open, so the market had not confirmed whether the line would hold.
Support sits between $88 and $90, with $85 and the $77 to $82 zone below it. That lower zone held prices in June and July.
Resistance begins around $95 to $98, where SOL consolidated in March, April and May. Above that, traders watch $100, then $110 to $115 and $120 to $124.
Analyst Jesse Olson wrote on X that SOL remains oversold on the daily chart. He said price has broken below his third target, which raises the odds of a move to target four, and asked whether target four will be enough.
$SOL remains ultra bearish aka oversold on the daily chart.
Price has broken below target three, increasing the odds of price hitting target four.
Will target four get it? https://t.co/RooIlhy9t7 pic.twitter.com/vSjfW6HPuo
— Jesse Olson (@JesseOlson) November 6, 2026
The Relative Strength Index stands at 30.06, just above the 30 oversold line. It has declined steadily since September.
The MACD line is at -4.55, below its signal line at -3.85, and the histogram reads -0.70. Analysts cite a bullish crossover and an RSI above 40 as signs buying is returning.
SOL was trading at $89.62 on Friday, with the daily candle still open and the intraday low at $88.82.


