






TLDR
- SOL is trading around $74–$76, down over 3% in 24 hours with $1.65B in volume
- A monthly TD Sequential “9” buy signal has appeared on SOL’s chart, according to analyst Ali Martinez
- Long traders took the brunt of liquidations — $13.06M of $14.37M total over 24 hours
- Analyst Crypto Patel says SOL’s $500 long-term target remains valid above the 0.5 Fibonacci level
- Key short-term levels: $77.35 to flip bullish, $70–$75 zone as critical support floor
Solana (SOL) is trading near $75.97, up 1.49% in the past 24 hours. Daily trading volume sits at $1.88 billion, with a market cap of $44.26 billion.
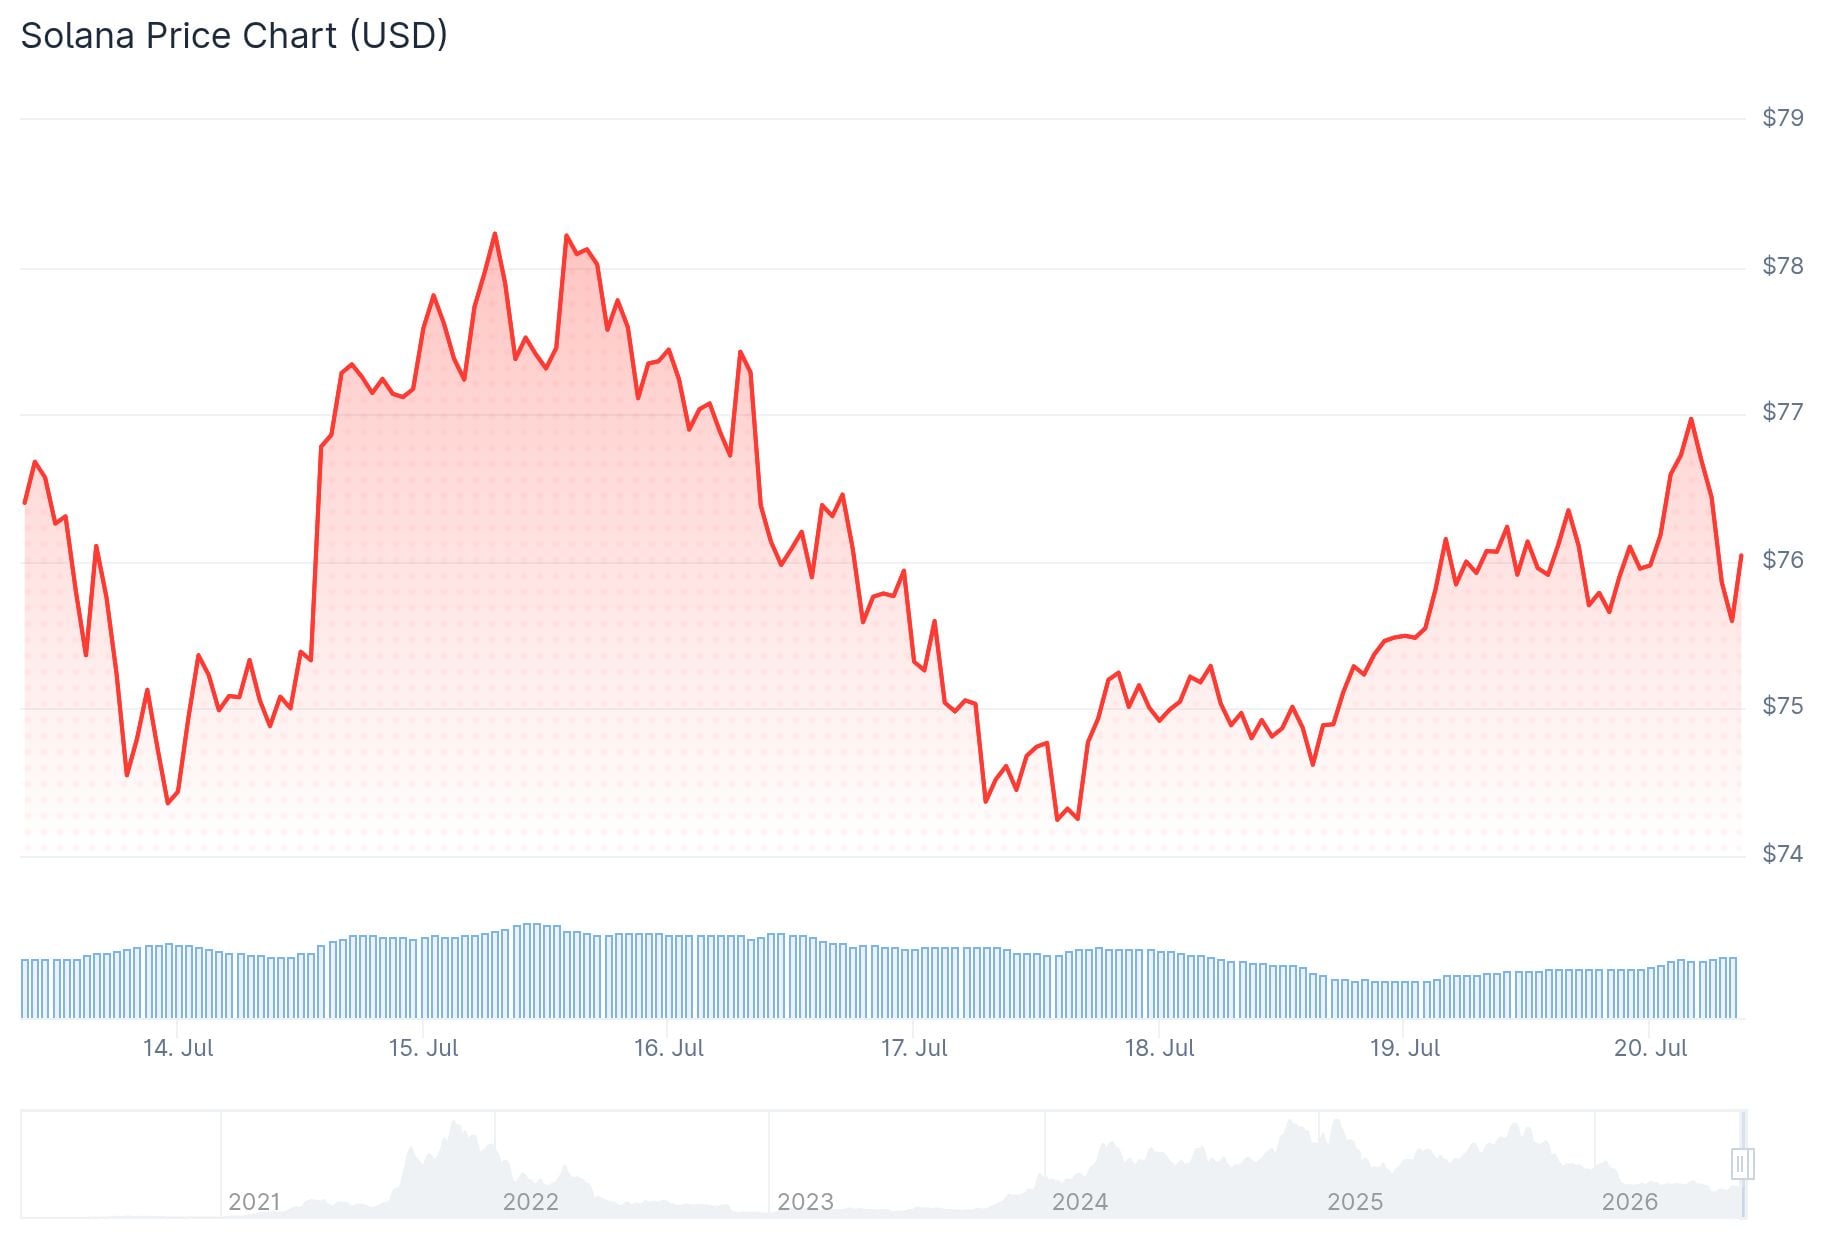
Despite the recent recovery, SOL is still down 5.9% over seven days and 8.9% over 14 days. The token does hold a 2.6% monthly gain.
Analyst Ali Martinez flagged a monthly TD Sequential “9” buy signal on SOL’s chart. The signal appeared after a decline from above $245 late last year to around $76.62.
SOLANA: BUY SIGNAL
The TD Sequential has just flashed a buy signal on the $SOL monthly chart, anticipating a macro trend shift or even the end of the bear market. https://t.co/FemtlavPcT pic.twitter.com/AA8MRE5jSz
— Ali Charts (@alicharts) July 17, 2026
The TD Sequential signal follows an extended bearish sequence and points to weakening downside momentum. Monthly signals carry more weight than signals on shorter timeframes.
For the setup to follow through, SOL needs to reclaim the $80–$85 range. A sustained monthly close above $100 would support a macro trend shift. A drop below $70–$75 would weaken the setup and could expose the $60 area.
Fibonacci Level Holds Key to Long-Term Target
Analyst Crypto Patel says the $500 long-term price target for SOL remains on the table — as long as it holds above the 0.5 Fibonacci retracement level. That level is considered an important part of the overall market structure.

BULLISH: If $SOL Holds Above the 0.5 Fibonacci Retracement, A Move Toward $500 Remains a High-Probability Scenario.@solana pic.twitter.com/G076gi1muF
— Crypto Patel (@CryptoPatel) July 19, 2026
Staying above the 0.5 Fibonacci level generally signals that an uptrend is still active, even during corrections.
On the short-term one-hour chart, a bearish pattern is in play. The entry zone sits between $76.45 and $76.70, with downside targets at $75.70, $74.30, and $73.60.
The bearish short-term setup stays valid as long as SOL trades below $77.30. A close above $77.35 would invalidate it.
Liquidations Hit Long Traders Hard
CoinGlass data shows long traders absorbed most of the recent losses. Total SOL liquidations over 24 hours reached $14.37 million. Long positions accounted for $13.06 million — about 91% of the total.
Over 12 hours, longs lost $7.66 million versus $1.07 million for shorts.
Separately, on July 12, SOL’s SuperTrend indicator on the three-day chart turned bullish — its first buy signal since October 10.
Between July 3 and July 11, 100 million SOL left exchange reserves. In the same period, 1.4 million new addresses joined the Solana network, according to Token Terminal data.
SOL continues to trade near a major historical volume zone that sits between current price levels and a broader macro expansion area.


