





TLDR
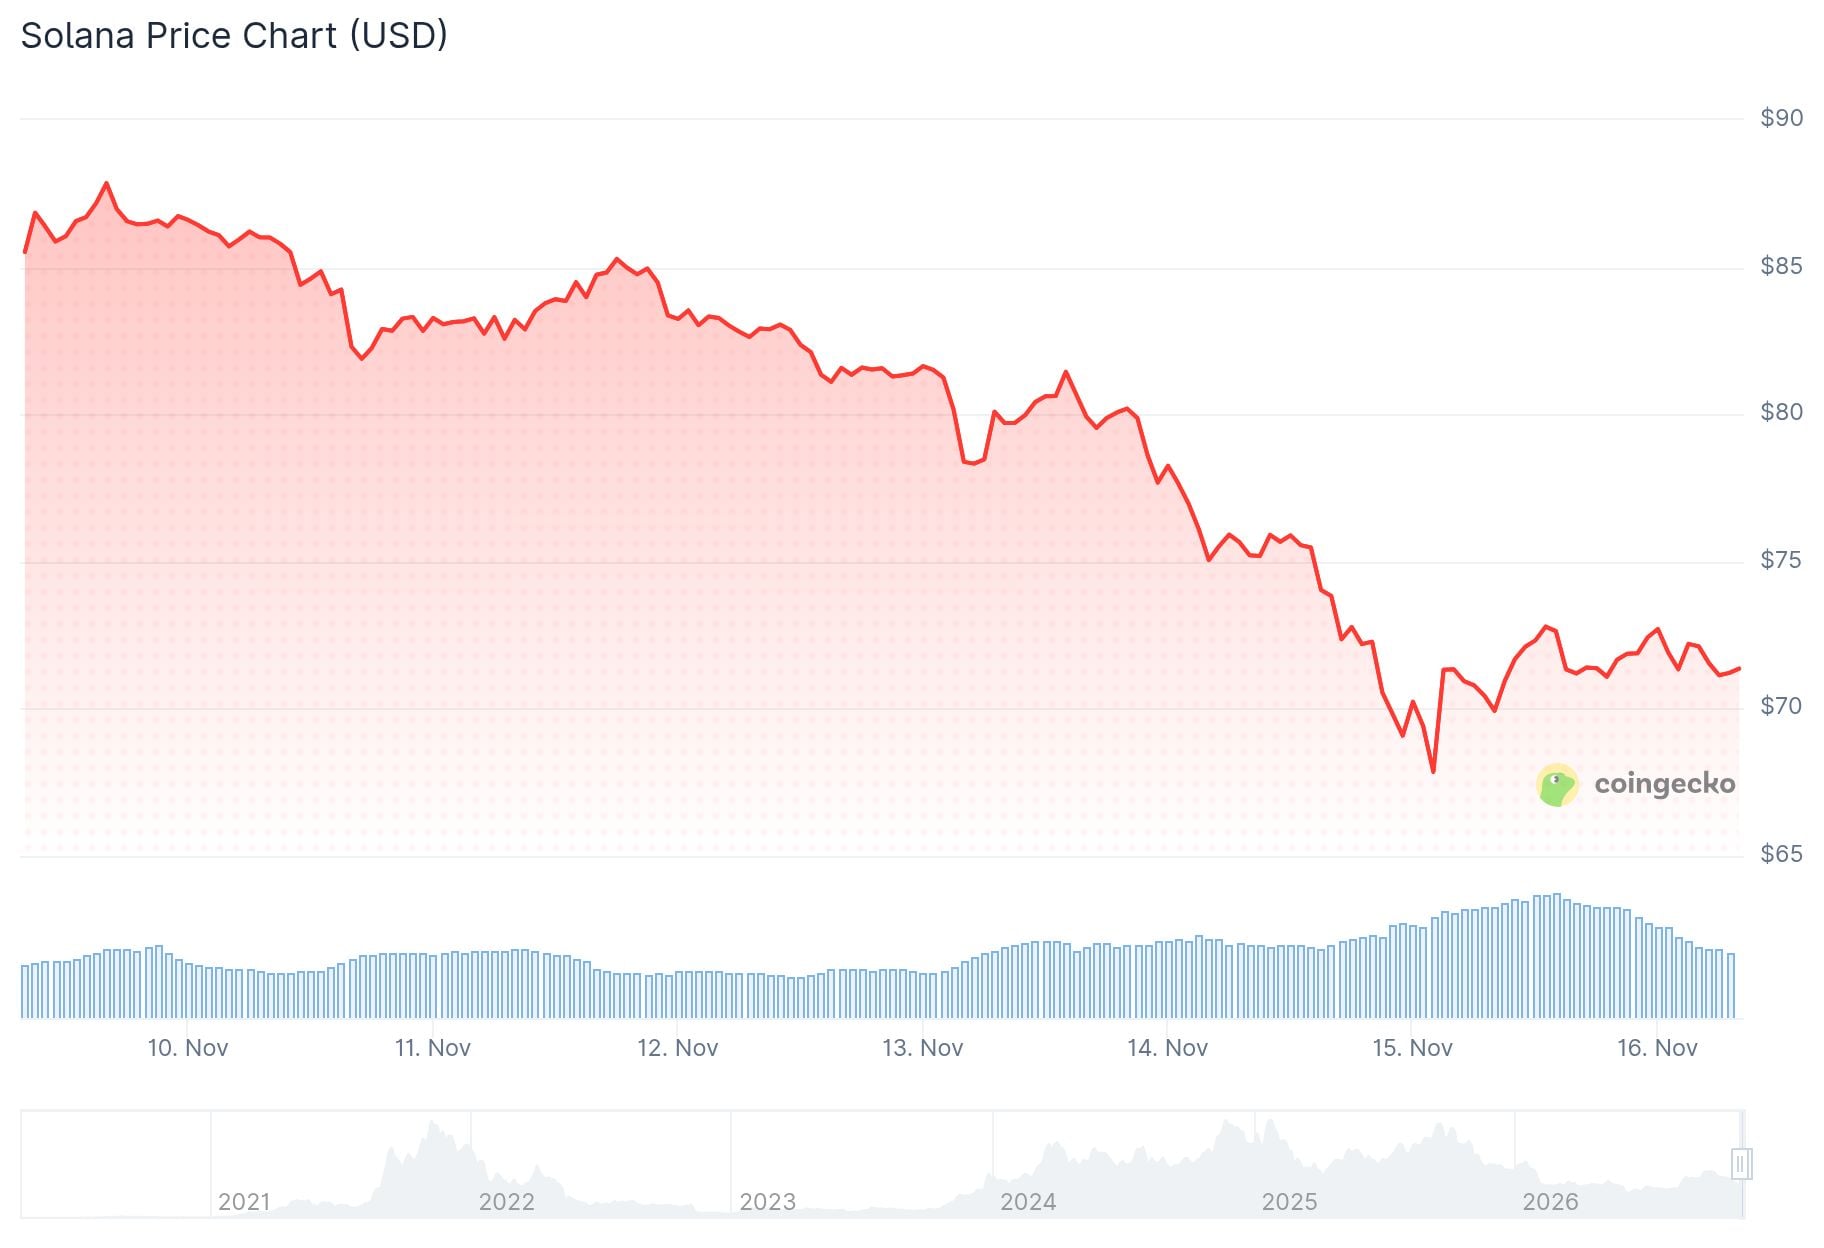
- SOL traded near $71.33 on November 16, down about 1.9% on the week.
- The price sits on a rising weekly support line that dates to late 2022.
- U.S. spot Solana ETFs posted seven straight daily outflows through November 13.
- DTCC plans to connect its Tokenization Service to Solana in the second half of 2027.
- Chart levels in focus are $80 and $95 to $100 on the upside and $60 on the downside.
Solana (SOL) changed hands near $71.33 on November 16, down about 1.9% over the week. The token now sits on a rising weekly support line that dates back to late 2022. The move leaves SOL at a key point on its weekly chart.
That line connects the late 2022 low with several major turning points through 2026. The current price zone of $70 to $72 lines up with it. Chart watchers treat that range as the main support area.
SOL failed to hold above the $120 area and then slid back toward long-term support. Buyers are trying to defend the line for now. The token has not yet broken below it.
$SOL has finally entered my TERRITORY ENTRY ZONE 😍
I have two major accumulation zones for my long-term $500–$1,000 targets:
🟢 Entry Zone 1: $70–$50
🟢 Entry Zone 2: Around $30My strategy is simple: I'll keep accumulating during every major crash instead of panic selling.
If… pic.twitter.com/9FxtnoZW88— Crypto Patel (@CryptoPatel) November 15, 2026
Weekly RSI stands at 37.05, below the neutral level of 50. That reading points to weak momentum. The token is not deeply oversold.
The MACD remains below zero. Its histogram has turned slightly positive. That suggests selling pressure may be easing, though the wider trend is still weak.
Levels on the Weekly Chart
If SOL closes the week above the trendline, the first recovery zone sits near $80. A stronger resistance area lies between $95 and $100. Both levels come from the weekly chart.

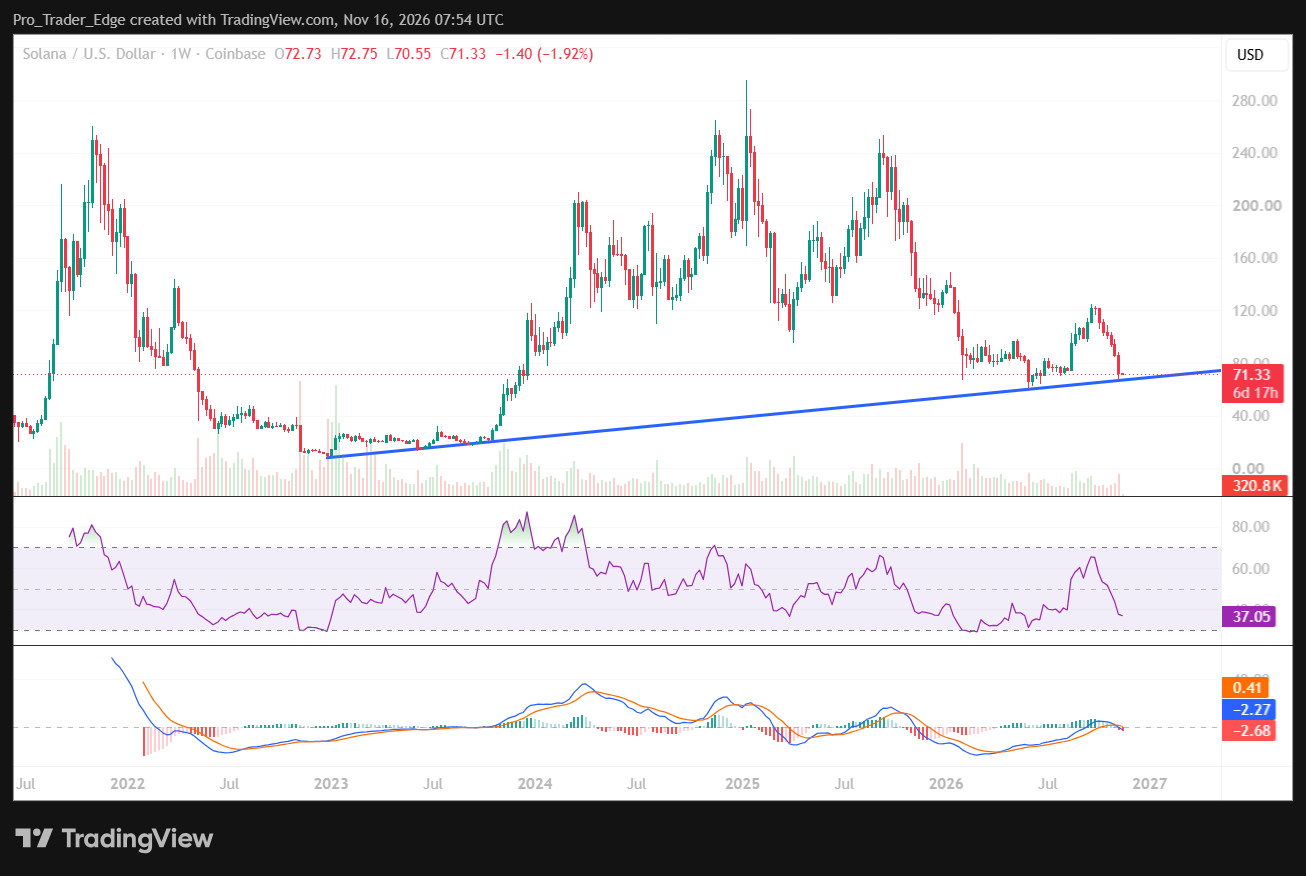
Above that, the next upside region is near $120. That is the same area SOL failed to hold before the slide.
A break below the line would shift attention to $60 as the first downside area. A wider support band could then form between $40 and $50. The weekly chart shows that band as a possible target if wider crypto weakness continues.
Farside Investors data show U.S. spot Solana ETFs lost $57 million in net outflows over seven sessions through November 13. Cumulative tracked flow since October 28 is now -$101.2 million.
November 13 brought a $3.1 million outflow. It was the seventh straight daily outflow session for the funds. That streak covers every session in the tracking window.
TokenPost reported a different weekly tally of $32.05 million in net outflows from November 9 to 13. It called that the second-largest weekly withdrawal on record for the category.
Even so, cumulative net inflows still stand at $1.41 billion. Total net assets in the funds are about $1.14 billion. The two trackers cover different date ranges, so their weekly totals differ.
Adoption News and Network Data
DTCC said on November 12 that it plans to connect its Tokenization Service to Solana. Eligible DTC-custodied assets are expected to be available on the network in the second half of 2027.
Samsung Wallet also now lets eligible U.S. Galaxy users buy, hold, send and receive USDC on Solana. The update adds a consumer-facing use for the network.
DefiLlama data show Solana holds about $4.70 billion in DeFi total value locked and a $14.08 billion stablecoin market cap as of November 16. The network logged roughly 2.33 million active addresses over the past 24 hours.
Daily DEX volume came in near $1.50 billion. Seven-day DEX volume is down 17.07%, and seven-day perpetuals volume is down 36.51%. Together, those readings show lower trading activity than in recent weeks.


