






TLDR
- S&P 500 is in an uptrend but pressing near channel resistance at 7,100–7,250
- U.S. GDP growth slowed to 0.5% annualized in Q4 2025, down from 4.4% in Q3
- March CPI rose to 3.3%, making Fed rate cuts harder to justify
- Forward earnings growth projected at 18.6% for 2026, giving the market a fundamental base
- A close below 6,400–6,500 would be the most serious bearish warning sign
The S&P 500 is still in an uptrend, but the picture has gotten more complicated. Inflation is rising again, GDP growth has slowed, and the index is now pressing into a key resistance zone.
Here is where things stand.
The index is trading near the upper end of a rising multi-year channel, around 7,100–7,250. That level has slowed rallies before. The market is not broken, but it is no longer sitting in a low-risk area.
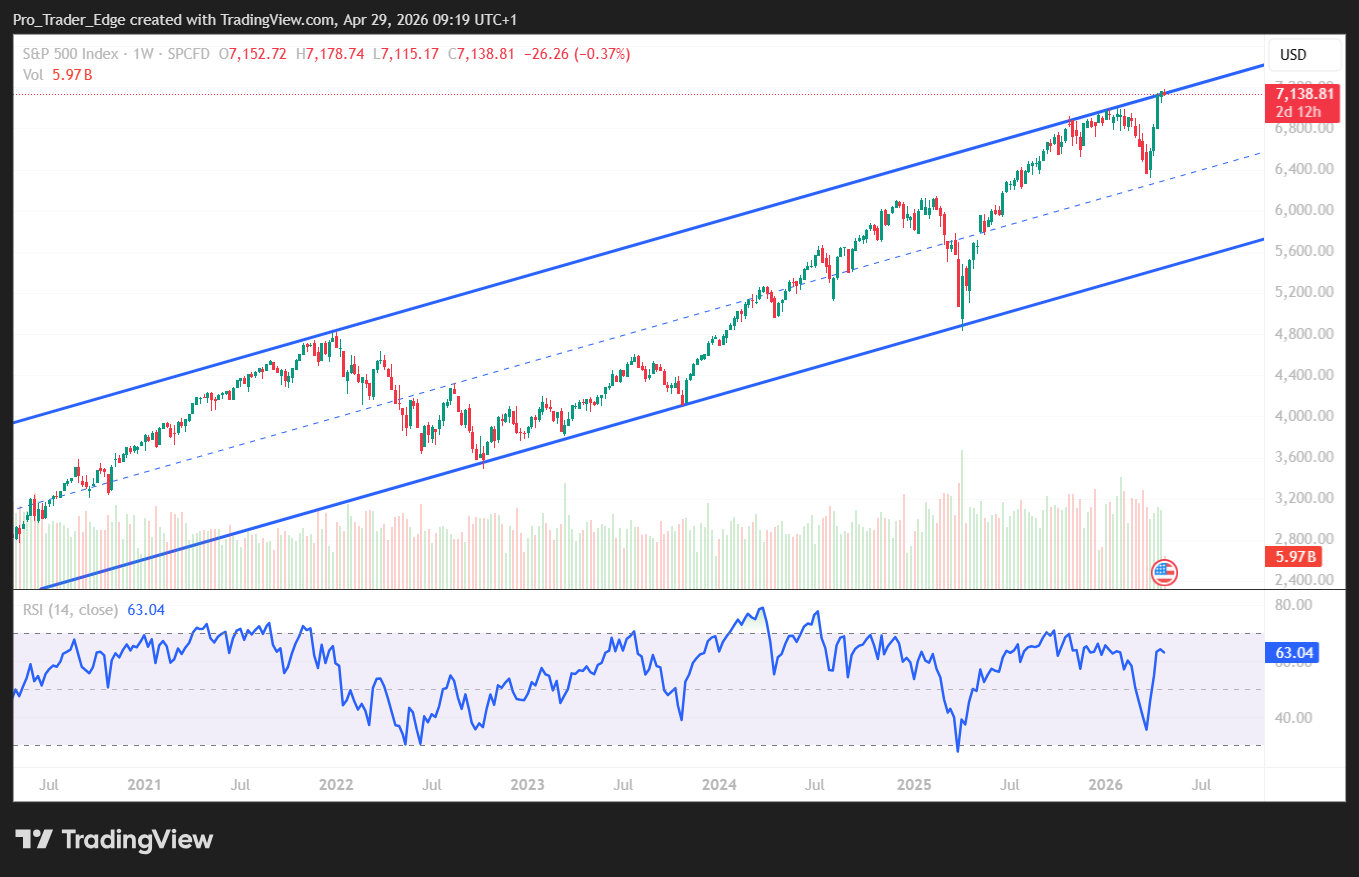
Short-term support sits around 6,800–6,900. A pullback that holds there would look like a normal reset. The more important support is 6,400–6,500, where the most recent rebound began.
U.S. real GDP grew at an annualized rate of 0.5% in Q4 2025, according to the Bureau of Economic Analysis. That is a sharp drop from 4.4% in Q3. The economy is still growing, but momentum has cooled.
At the same time, inflation picked up. March CPI rose 3.3% year over year, up from 2.4% in February. Core CPI came in at 2.6%. Energy prices were a big driver, with gasoline up 18.9% over the year.
The Federal Reserve’s current target rate sits at 3.50%–3.75%. With inflation moving higher again, the case for cutting rates quickly has weakened. High rates keep pressure on stock valuations, especially for growth companies.

The Bull Case
The bull case rests on earnings. S&P 500 companies are projected to grow earnings by 18.6% in 2026, according to FactSet. All eleven sectors are reporting year-over-year revenue growth so far this earnings season.
If earnings hold up and inflation cools after the energy spike, the market can support higher prices even with valuations above their long-term averages.
A weekly close above 7,200–7,250 would be a positive technical signal. Upside targets after that would be around 7,400, and then 7,600.
The bull case also depends on recession risk staying contained. If the labor market holds steady and credit conditions stay calm, investors are likely to keep buying dips.
The Bear Case
The bear case starts with valuation. The S&P 500 trades at a forward price-to-earnings ratio of 20.9. That is above the five-year average of 19.9 and the ten-year average of 18.9, according to FactSet.
That does not mean the market must fall. But there is less room for error if earnings disappoint or Treasury yields climb further.
The index is also pressing into the top of its rising channel. That is not bearish on its own, but it is not an ideal entry point either.
A failed breakout above 7,200–7,250 followed by a drop back below 7,000 would be the first warning sign. A weekly close below 6,400–6,500 would be more serious and would suggest the recent rebound has failed.
The most likely triggers for a bearish move would be sticky inflation, rising Treasury yields, or weaker-than-expected earnings guidance from major companies.
Final Thoughts
The S&P 500 trend is still intact. Earnings growth is real, dip-buying has been consistent, and recession risk looks moderate rather than severe.
The next meaningful data points are upcoming inflation readings and earnings guidance from major companies reporting this quarter.
Stop guessing and start investing with confidence. KnockoutStocks gives you the AI insights, market intelligence, and stock research you need to spot opportunities, cut through the noise, and make smarter investment decisions — all in one powerful platform.
Sign up today and get 50% OFF full access to our premium stock picks.
Simply use coupon code SPECIAL50 at checkout to claim your exclusive discount.
Get 3 Free Stock Ebooks
Discover top-performing stocks in AI, Crypto, and Technology with expert analysis.
- Top 10 AI Stocks - Leading AI companies
- Top 10 Crypto Stocks - Blockchain leaders
- Top 10 Tech Stocks - Tech giants



