






TLDR
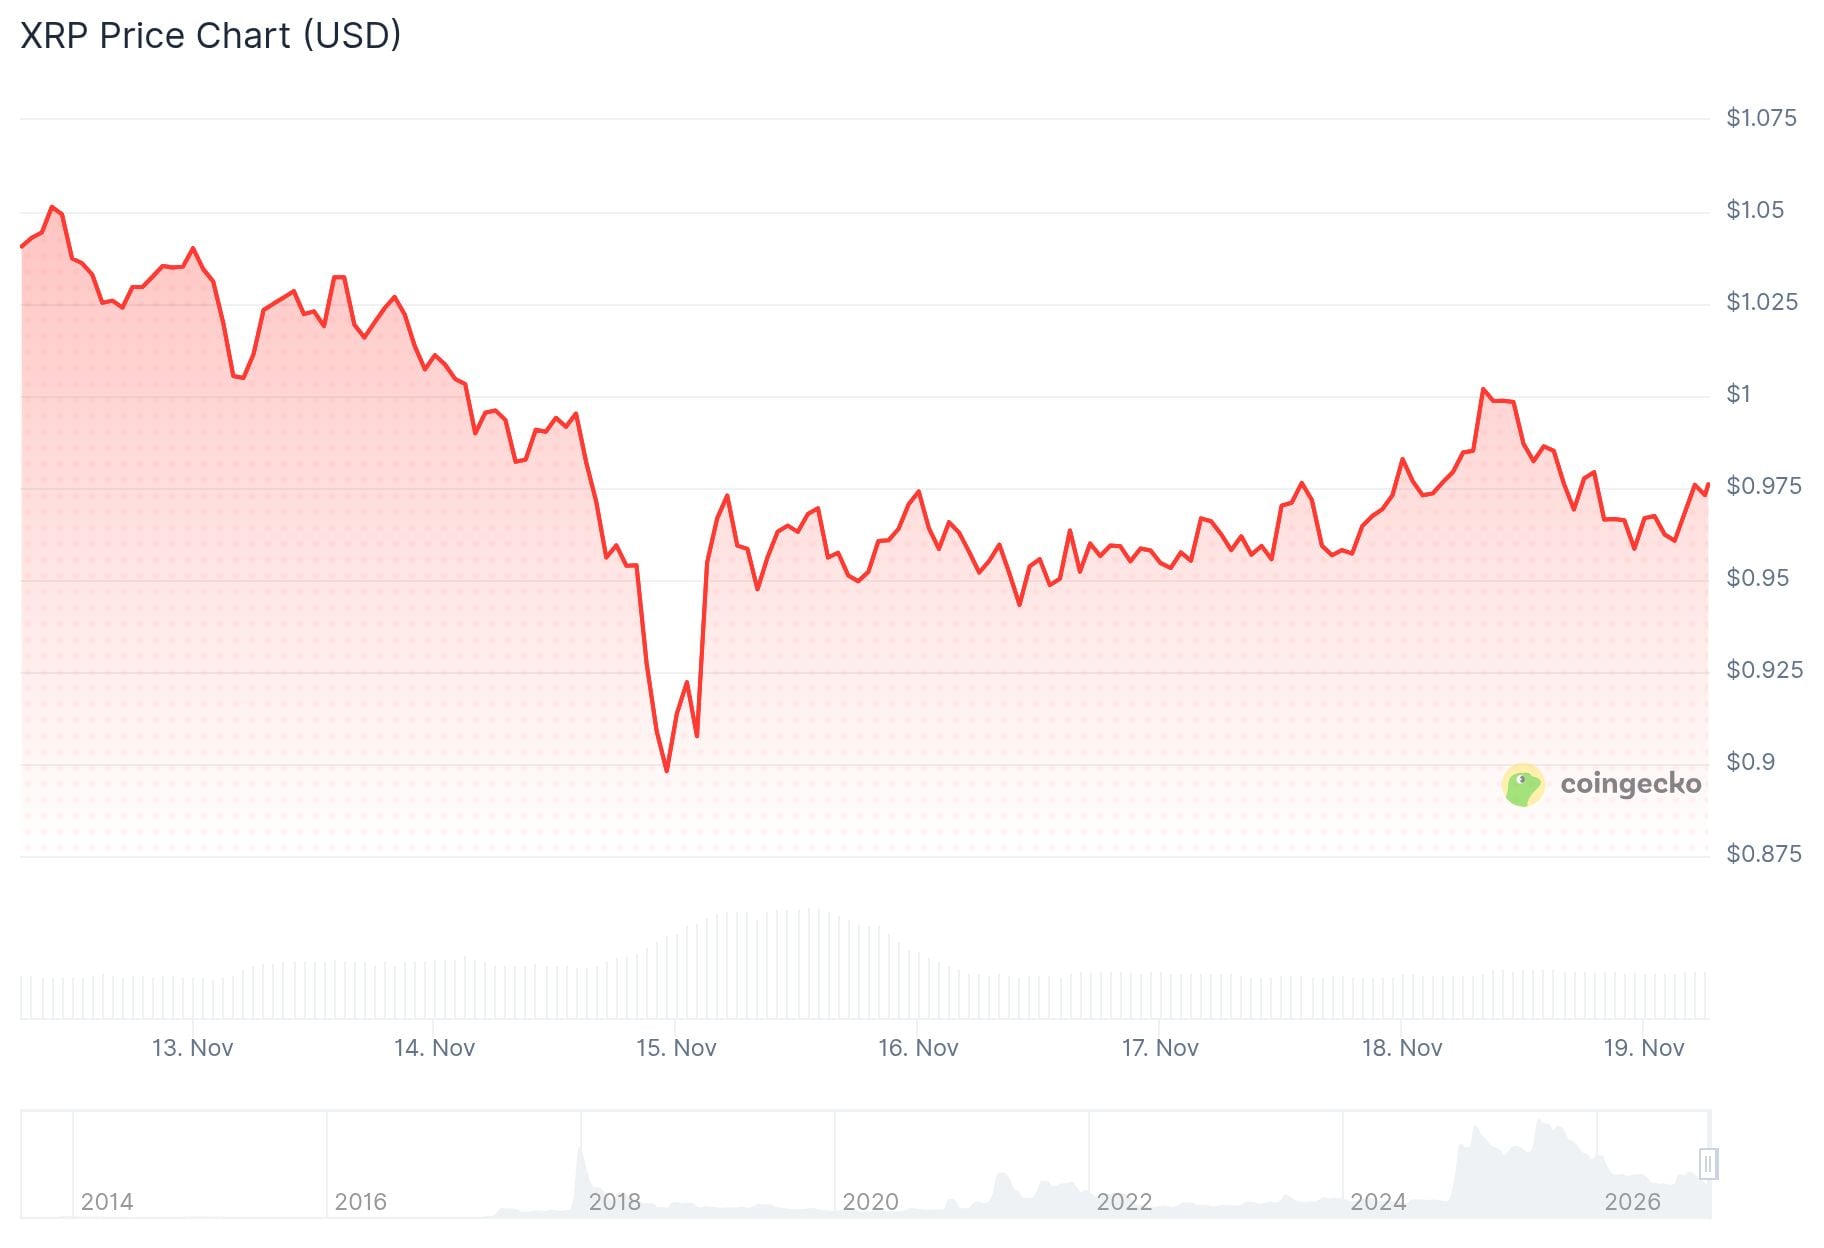
- XRP trades near $0.974 after slipping below the $1 mark.
- The weekly RSI sits at 35.79, and the MACD has turned bearish.
- Support sits at $0.90 to $0.95, with $0.75 to $0.80 below that.
- US spot XRP ETFs saw about $19.1 million in outflows in the week ended November 13.
- BNY added XRP and RLUSD support to its custody platform on October 27.
XRP traded near $0.97 on November 19 after slipping below the $1 mark. The token has lost more than 70% of its value since it reached about $3.65 in 2025.
The weekly chart shows a long downtrend that began after the July 2025 peak above $3.50. Each recovery attempt since then has stalled at a lower high.
The latest weekly candle shows XRP at around $0.974. Price dipped to $0.942 during the week, which put it close to the $0.90 to $1.00 support area.
Weekly Indicators and Key Price Levels
The weekly Relative Strength Index (RSI) sits at 35.79. That is close to the 30 level that traders treat as oversold. The reading has fallen toward that threshold as the downtrend has continued, but it does not confirm that a bottom has formed.
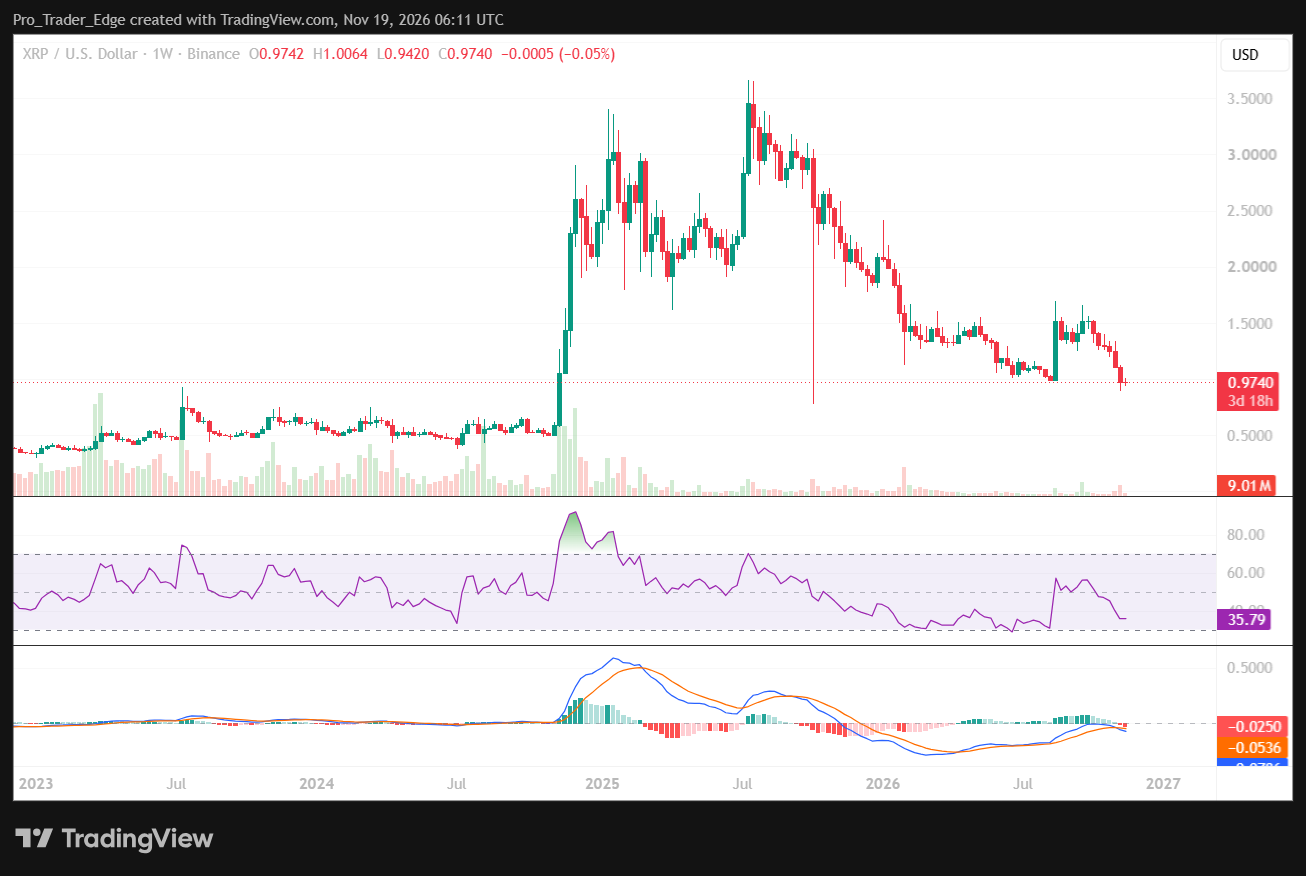
The Moving Average Convergence Divergence (MACD) indicator has shown a bearish crossover. Its histogram has turned negative, and the rebound seen in September and October has faded.
Taken together, the two readings show weaker momentum on the weekly timeframe. The RSI is falling toward 30 while the MACD histogram sits below zero.
XRP UPDATE
Blue support has never failed. Every previous touch led to a new ATH.
I don't expect this time to be different.
Based on previous reactions, I believe $XRP could repeat its past moves and rally toward $7 from here.
Let's see if history repeats itself. pic.twitter.com/pW3iidPuYC
— Celal Kucuker (@CelalKucuker) November 18, 2026

Support is the first area traders are watching, and the $0.90 to $0.95 zone sits closest to the current price. A drop below $0.90 would bring the $0.75 to $0.80 range into view, with stronger historical support near $0.60.
Resistance starts at $1.00 to $1.10. Above that sit $1.30 and $1.50, and a sustained move over $1.50 would offer stronger evidence of a trend reversal.
The $1 mark is also a psychological level for traders. XRP sits about 2.6% below it, and a move back above would put the $1.10 resistance in reach.
The distance to past highs is wide. A return to the $3.65 peak would need a gain of roughly 275% from today’s price, while $10 would need about 927%.
Institutional Moves and ETF Flows
On October 27, Ripple and BNY announced an expanded partnership. It covers institutional digital asset custody and tokenized trade finance.
Support for XRP and Ripple’s RLUSD stablecoin was confirmed on the Digital Asset Custody platform. The change could improve access for institutional clients.
XRP has also drawn institutional interest through ETFs, custody services and the growing XRP Ledger ecosystem. The price has still fallen below $1 during that period.
Price forecasts from analysts sit far above the current level. Standard Chartered analyst Geoffrey Kendrick revised his XRP targets earlier in 2026.
His new targets are $7 for 2027, $12.60 for 2028 and $19.60 for 2029. The 2026 target was cut from $8 to $2.80 in the same revision.
Those figures were published before XRP fell under $1. The spot price now sits well below the $2.80 level set for this year.
US spot XRP ETFs recorded about $19.1 million in withdrawals during the week that ended November 13. Flows from these funds are one of the ways institutions can gain exposure to the token.
Further outflows followed on November 17. Preliminary tracking showed no net flows on November 18.


