






The global crypto ETF market held $124.77 billion in total assets under management (AUM) as of October 7, 2026. That figure covers 32 active funds run by 11 issuers, with products listed in both the United States and Hong Kong.
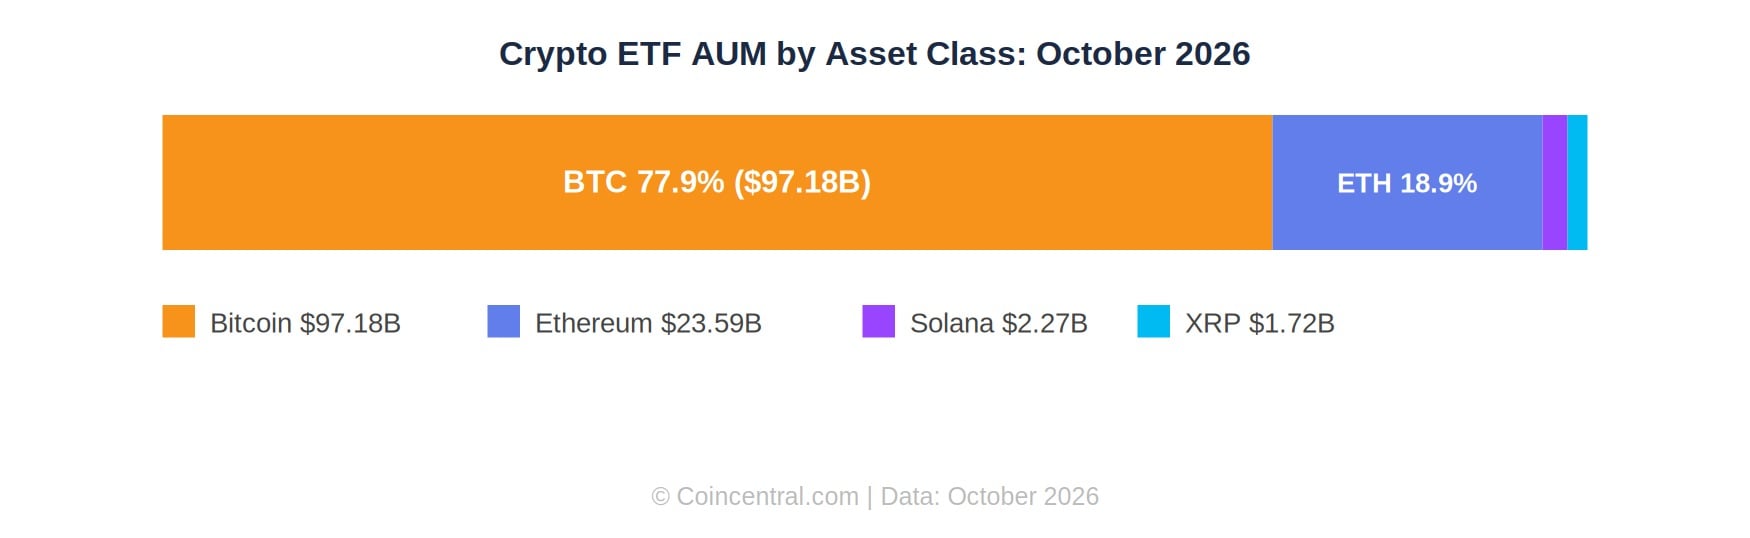
Bitcoin ETFs account for most of that total. BTC-focused funds hold $97.18 billion in AUM, while Ethereum funds hold $23.59 billion. Solana and XRP ETFs make up the remainder.
This article breaks down the latest data on fund flows, AUM rankings, institutional activity, and expense ratios across the full crypto ETF market, using data from October 7 and October 8, 2026.
The Crypto ETF Market at a Glance
The crypto ETF market grew from near zero in early 2024, when US spot Bitcoin ETFs launched, to over $100 billion in AUM within two years. By October 2026, total AUM across all tracked products reached $124.77 billion.
ETFs now hold approximately 8.80% of the combined market cap of all crypto assets they track. That includes 1.28 million Bitcoin held in fund structures, equal to roughly 6.1% of the total 21 million BTC supply. ETFs also hold 5.9 million Ethereum.
Bitcoin ETFs account for 77.9% of total crypto ETF AUM. Ethereum ETFs hold 18.9%. Solana ETFs hold $2.27 billion and XRP ETFs hold $1.72 billion.
The market spans 32 active funds managed by 11 issuers. Three additional Hong Kong-listed funds have data still being compiled. Spot ETFs hold the bulk of AUM, while futures-based funds account for a smaller share.

The 35 tracked funds carry a combined 24-hour trading volume of roughly $143 million, showing ongoing daily market activity even during periods of net outflows.
Bitcoin ETF Rankings: Who Holds the Most
BlackRock’s iShares Bitcoin Trust (IBIT) is the largest crypto ETF in the world by a wide margin. It holds $68.67 billion in assets, more than four times the next-largest Bitcoin fund.
Fidelity’s Wise Origin Bitcoin Fund (FBTC) is in second place with $15.66 billion. The gap between IBIT and FBTC is $53 billion. That spread reflects how quickly IBIT accumulated assets after launch in January 2024.
Grayscale’s Bitcoin Trust ETF (GBTC) is third with $10.56 billion. It has been losing AUM steadily since spot Bitcoin ETFs launched. Its 1.50% expense ratio is the highest among spot Bitcoin products and has pushed investors toward lower-cost alternatives.
Grayscale responded by launching its Bitcoin Mini Trust (ticker: BTC) at a 0.15% fee. That fund now holds $5.42 billion, capturing some of the outflow from GBTC and offering existing Grayscale investors a cheaper route to stay in the family.
Bitwise Bitcoin ETF (BITB) holds $3.24 billion and charges 0.20%. ARK 21Shares Bitcoin ETF (ARKB) holds $2.87 billion at 0.21%. VanEck’s HODL holds $1.26 billion and currently charges 0.00%, though that reflects a fee waiver rather than a permanent rate.
Over the past 30 days, IBIT attracted $1.47 billion in net inflows and FBTC added $357.92 million. ARKB shed $224.28 million in that same period, and BITB lost $60.43 million. Smaller funds like EZBC, BTCO, and BRRR saw flat or minimal flows.
The top seven Bitcoin ETFs together hold more than $110 billion in combined AUM. IBIT alone represents over 61% of all BTC ETF assets, making it one of the fastest-growing ETFs in the history of the US market across all asset classes.
| # | Ticker | Issuer | Type | AUM | Exp. Ratio | 30-Day Flow |
|---|---|---|---|---|---|---|
| 1 | IBIT | BlackRock | Spot | $68.67B | 0.25% | +$1.47B |
| 2 | FBTC | Fidelity | Spot | $15.66B | 0.25% | +$357.92M |
| 3 | GBTC | Grayscale | Spot | $10.56B | 1.50% | -$193.53M |
| 4 | BTC | Grayscale Mini | Spot | $5.42B | 0.15% | +$19.67M |
| 5 | BITB | Bitwise | Spot | $3.24B | 0.20% | -$60.43M |
| 6 | ARKB | ARK 21Shares | Spot | $2.87B | 0.21% | -$224.28M |
| 7 | BITO | ProShares | Futures | $1.71B | 0.95% | — |
| 8 | HODL | VanEck | Spot | $1.26B | 0.00%* | — |
*HODL fee is currently waived. Standard rate is 0.20%.
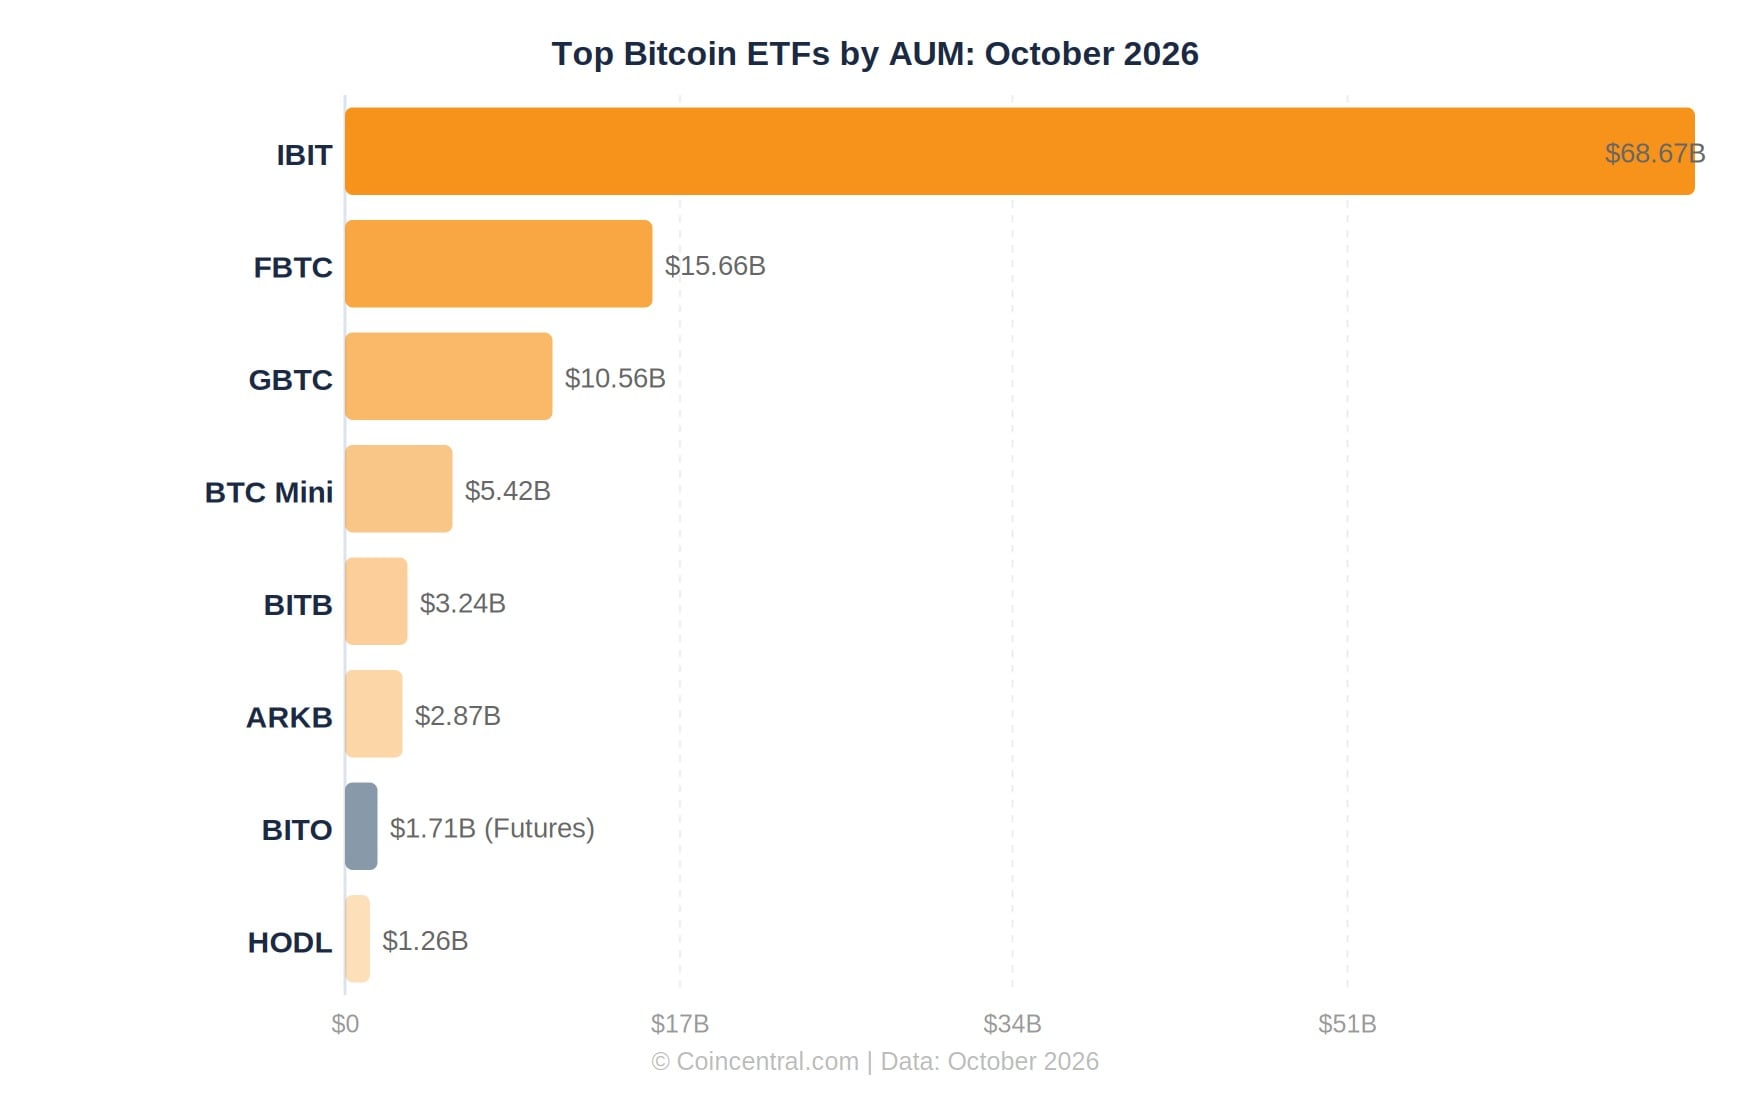 Figure 2: Top Bitcoin ETFs by AUM, October 2026
Ethereum ETFs: A Smaller but Active Market
The Ethereum ETF market launched later than Bitcoin’s and remains smaller. Total ETH ETF AUM stands at $23.59 billion as of October 2026, compared to $97.18 billion for Bitcoin ETFs.
BlackRock leads the Ethereum market with its iShares Ethereum Trust ETF (ETHA). It holds $8.61 billion in assets, equal to 36.5% of the entire ETH ETF market on its own. The fund holds 3.53 million ETH.
Grayscale operates two Ethereum products. Its Ethereum Staking Mini ETF (ticker: ETH) holds $2.20 billion at a 0.15% fee. The older Grayscale Ethereum Staking ETF (ETHE) holds $1.83 billion at a 2.50% fee, the highest in the entire crypto ETF space.
Fidelity’s Ethereum Fund (FETH) holds $1.37 billion at 0.25%. Bitwise’s Ethereum ETF (ETHW) holds approximately $279 million, and VanEck’s Ethereum ETF (ETHV) holds around $120 million.
BlackRock’s ETHA alone holds more AUM than the next five Ethereum ETFs combined. The market concentration mirrors what has happened in the Bitcoin ETF space, with one large provider dominating.
Ethereum ETF AUM represents about 7.61% of ETH’s total market cap, slightly lower than Bitcoin’s ETF market cap share of 9.02%. Both figures have risen steadily through 2026 as institutional demand has increased.
Smaller ETH ETF providers include Franklin Templeton (EZET, $53M), Invesco (QETH, $27M), and ProShares futures fund EETH ($68M). These funds serve investors who want options beyond the top two issuers or who prefer futures-based exposure.
| # | Ticker | Issuer | Type | AUM | Exp. Ratio |
|---|---|---|---|---|---|
| 1 | ETHA | BlackRock | Spot | $8.61B | 0.25% |
| 2 | ETH | Grayscale Mini | Spot | $2.20B | 0.15% |
| 3 | ETHE | Grayscale | Spot | $1.83B | 2.50% |
| 4 | FETH | Fidelity | Spot | $1.37B | 0.25% |
| 5 | ETHW | Bitwise | Spot | $279M | 0.20% |
| 6 | ETHV | VanEck | Spot | $120M | 0.20% |
| 7 | EETH | ProShares | Futures | $68M | — |
| 8 | EZET | Franklin Templeton | Spot | $53M | 0.19% |
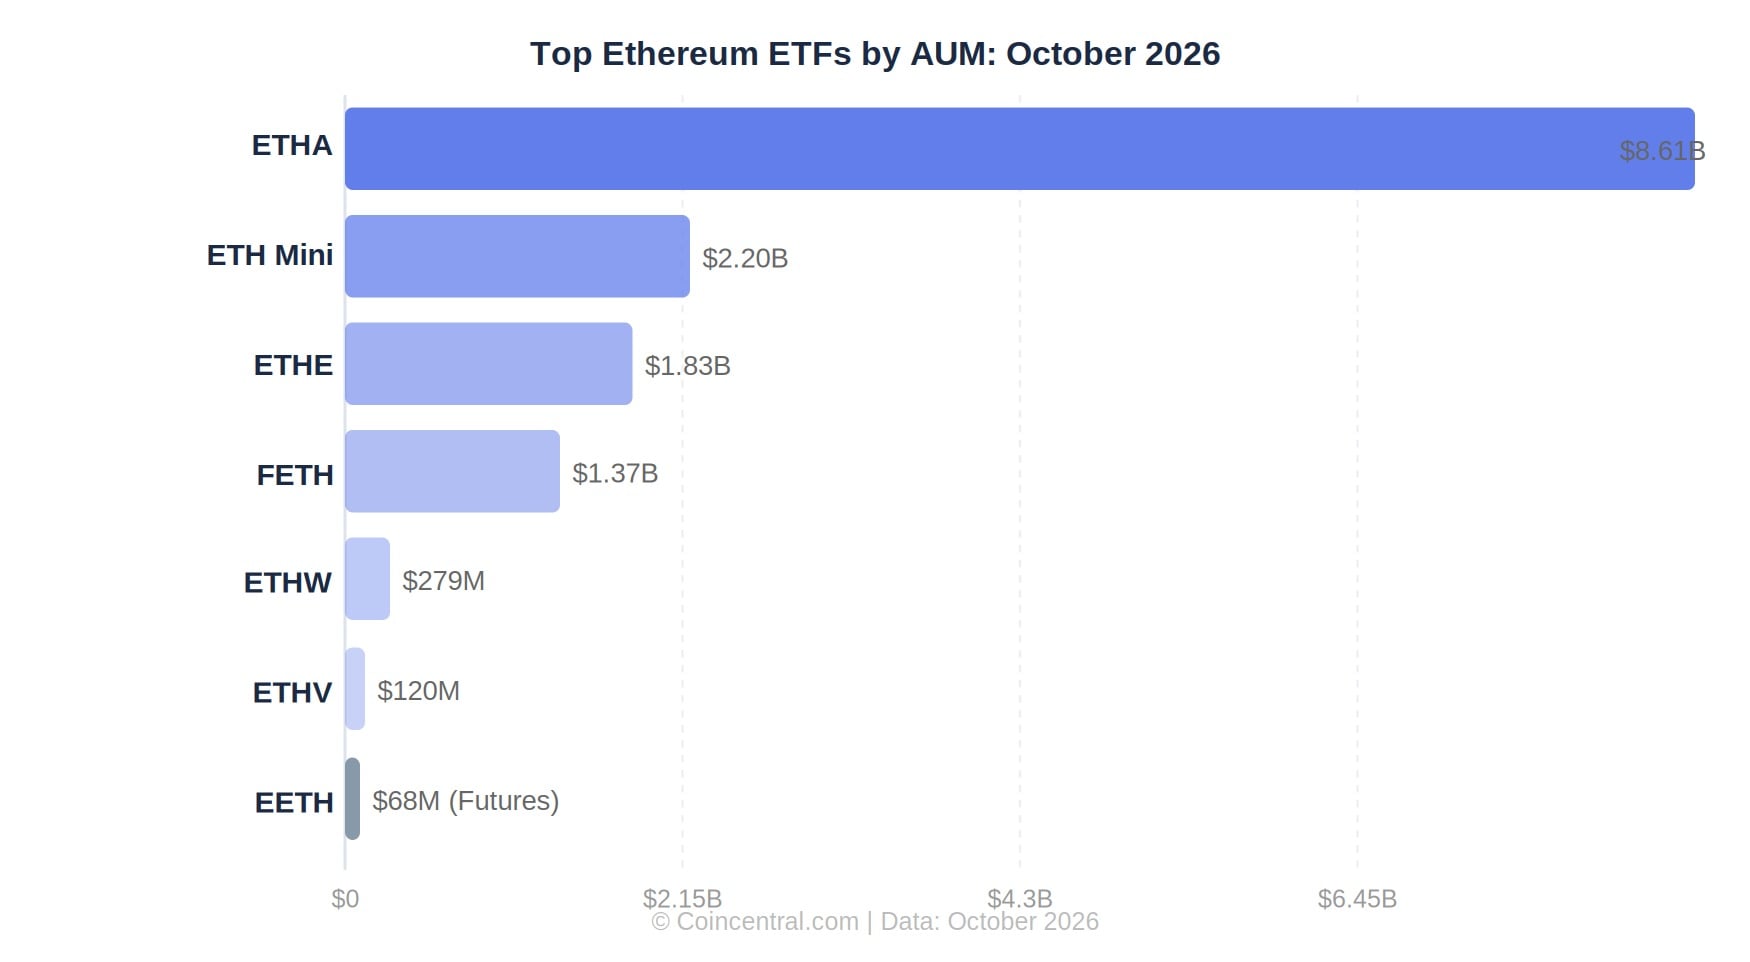 Figure 3: Top Ethereum ETFs by AUM, October 2026
Daily Flows: October 7, 2026
On October 7, 2026, crypto ETFs recorded a total net outflow of $650.6 million. That was the combined total across all tracked funds and asset classes on a single trading day.
Bitcoin ETFs saw the largest outflow, losing $484.9 million in a single day. Ethereum ETFs shed $160.9 million. Solana ETFs reported outflows of $4.8 million. XRP and Hyperliquid ETFs saw zero net flows.
IBIT recorded the largest single-fund outflow at -$207.7 million. BlackRock’s ETHA followed with an outflow of -$116.1 million. The next day, October 8, GBTC reported a separate $150 million single-day outflow.
Some funds were flat during this period. Several smaller funds reported zero net flows, meaning no share creation or redemption activity. Flat days are common for smaller funds with limited institutional trading volume.
The five-day rolling total as of October 7 was -$674.57 million, and the one-week total stood at -$729.84 million. This confirms that the first week of October 2026 was broadly a period of net selling across crypto ETFs.
Despite the scale of the daily figures, the $650.6 million outflow represents less than 0.6% of total crypto ETF AUM. Large single-day outflows can be driven by a small number of institutional redemptions and do not always reflect a broad shift in investor sentiment over time.
| Asset | Net Flow (Oct 7) | No. of Funds | Largest Single Outflow |
|---|---|---|---|
| Bitcoin | -$484.9M | 11 | IBIT: -$207.7M |
| Ethereum | -$160.9M | 9 | ETHA: -$116.1M |
| Solana | -$4.8M | 5 | BSOL: -$4.8M |
| XRP | $0 | 4 | — |
| Hyperliquid | $0 | 3 | — |
| Total | -$650.6M | 32 | IBIT: -$207.7M |
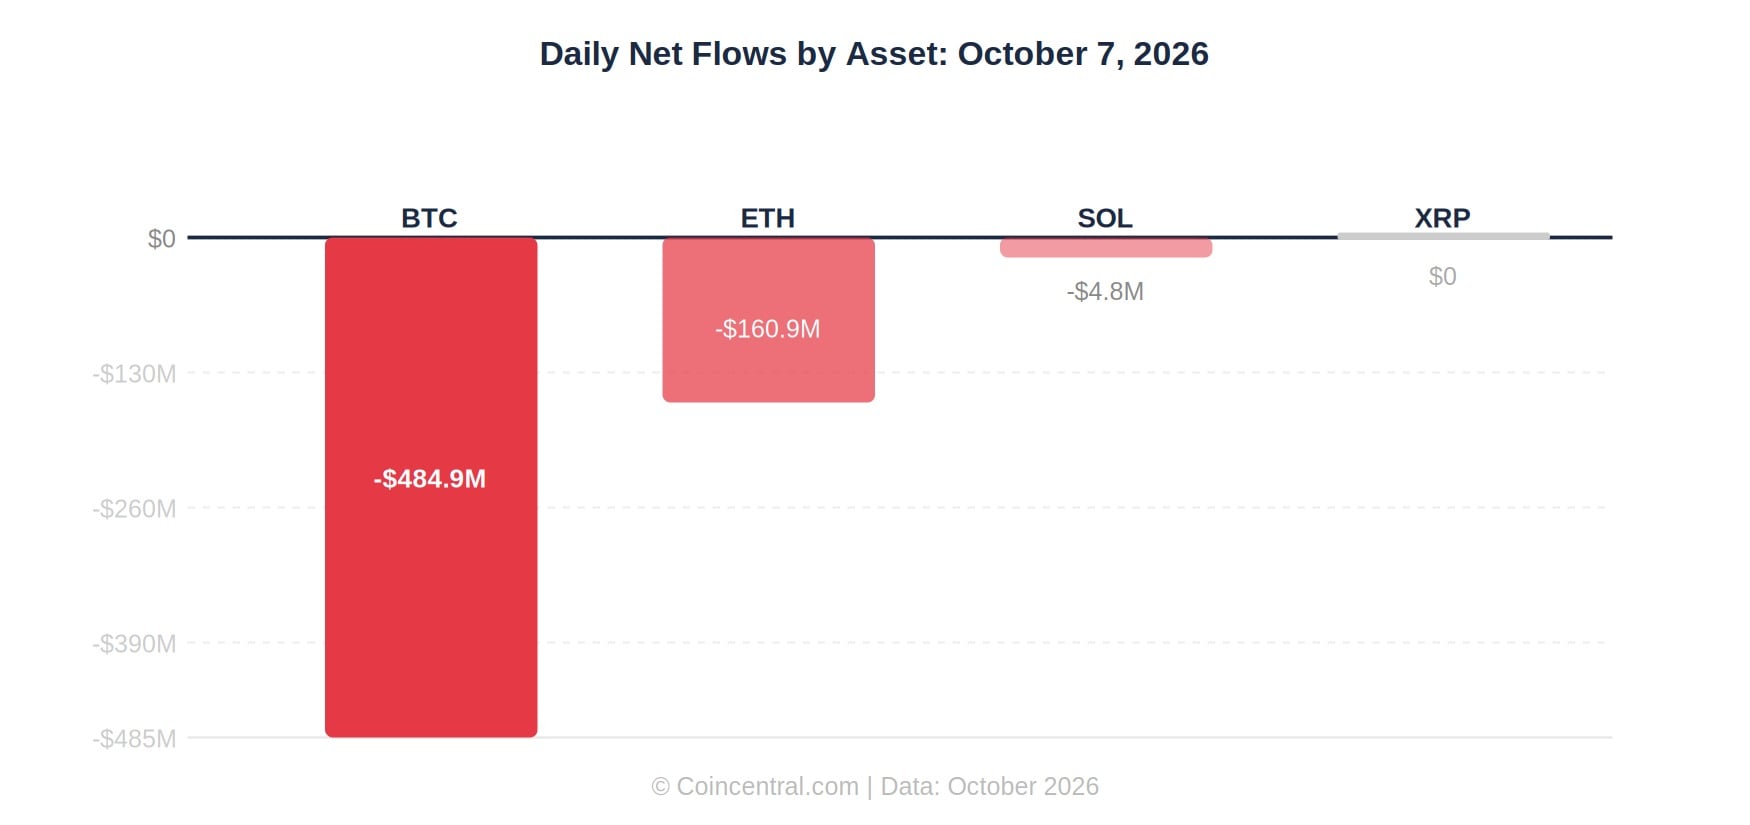
Figure 4: Crypto ETF Daily Net Flows by Asset, October 7, 2026
How Flows Have Trended Over Time
While October 7 showed heavy outflows, the monthly and quarterly pictures tell a different story. Over the past 30 days, crypto ETFs attracted $2.35 billion in net inflows. That puts one bad day inside a broader period of positive demand.
The last full quarter (July through September 2026) brought in $9.19 billion in net inflows. That quarterly figure is one of the strongest on record for the crypto ETF market.
The strongest single month on record was July 2025, when crypto ETFs pulled in $11.45 billion. That was a period of strong crypto price moves and rising institutional involvement across multiple asset classes.
The weakest month was June 2026, with net outflows of $4.98 billion. That month saw broad weakness in crypto prices, which led to widespread ETF redemptions across Bitcoin and Ethereum funds.
The five-day rolling outflow of $674.57 million and the weekly total of $729.84 million confirm that the start of October 2026 was a soft period. But the 30-day and 90-day data remain in net positive territory.
The divergence between short-term and long-term flow trends is a common feature of the crypto ETF market. Weeks of outflows can occur inside months that still end net positive. Investors using daily flow numbers should look at the wider trend before drawing conclusions.
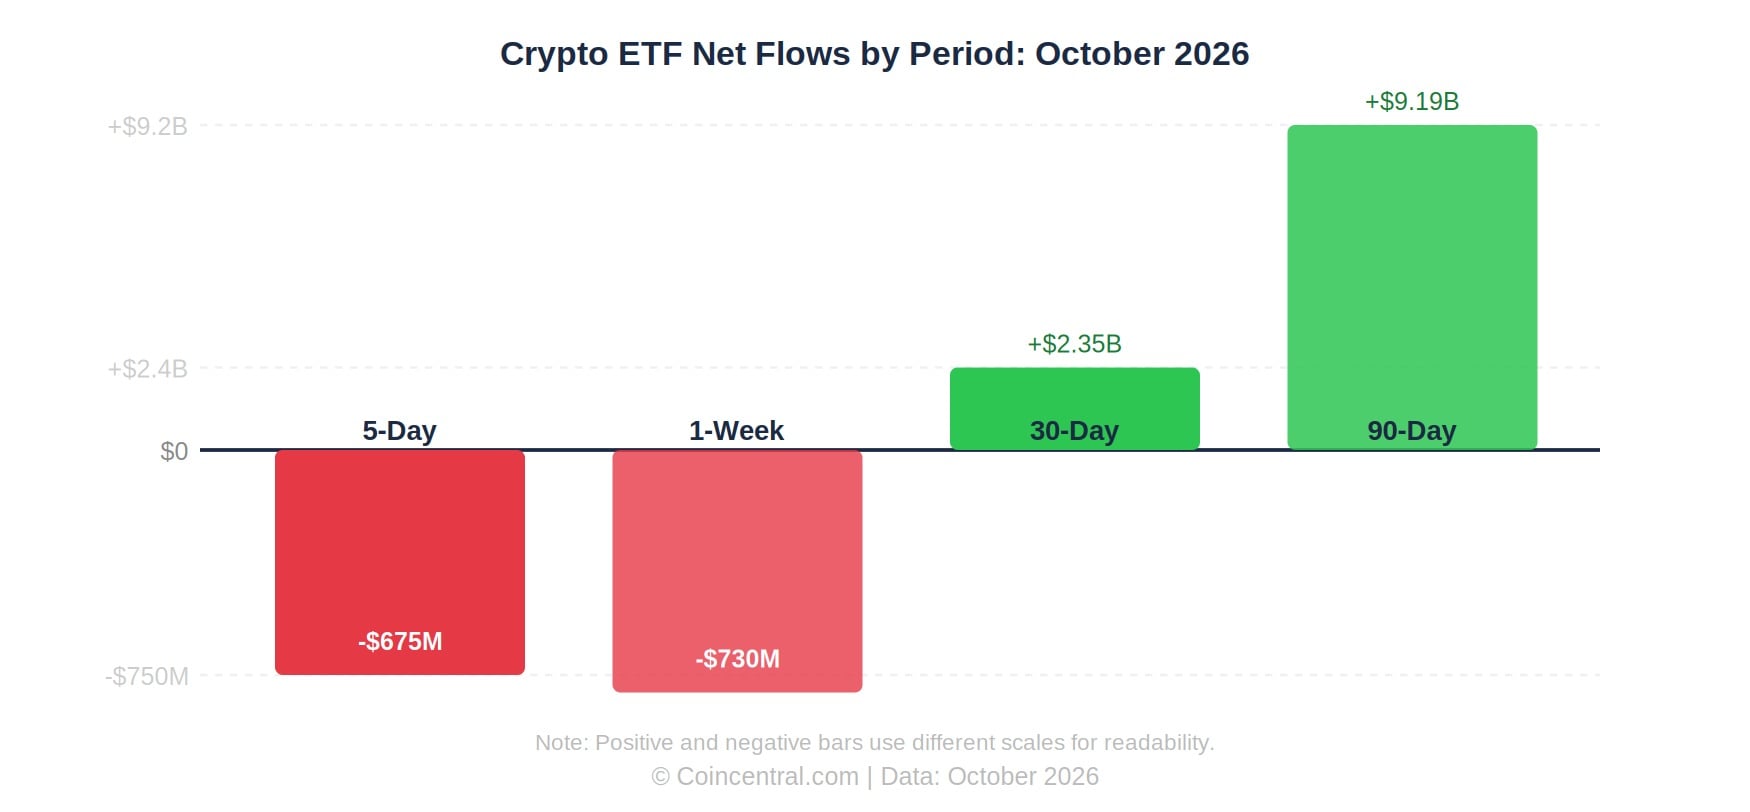
Figure 5: Crypto ETF Net Flows by Period, October 2026
The Biggest Issuers: Institutional Rankings
BlackRock has taken the top position among ETF issuers by a wide margin. Its two products, IBIT and ETHA, have attracted a combined $78.68 billion in cumulative net inflows since launch.
Fidelity is second with $13.42 billion in total net inflows across its Bitcoin and Ethereum funds. Bitwise is third with $4.41 billion, followed by ARK 21Shares at $1.20 billion and VanEck at $1.01 billion.
Grayscale is the outlier among major issuers. Its products have seen $28.11 billion more leave than enter since the spot ETF era began. That persistent outflow is tied directly to the high fees on GBTC at 1.50% and ETHE at 2.50%.
Grayscale manages seven crypto ETFs in total, more than any other single issuer. But the cumulative outflow figure reflects the years-long trend of investors moving to lower-cost alternatives once they became available.
Grayscale’s AUM remains large because its funds have been in operation longer and because rising crypto prices have lifted the value of assets still held inside them. But net flows have trended negative on a consistent basis since early 2024.
Fidelity’s four crypto ETFs include both Bitcoin and Ethereum spot products. Along with BlackRock, Fidelity has been one of the two main destinations for new money entering the crypto ETF market over the past two years.
| Issuer | No. of ETFs | Cumulative Net Inflow |
|---|---|---|
| BlackRock | 2 | +$78.68B |
| Fidelity | 4 | +$13.42B |
| Bitwise | 5 | +$4.41B |
| ARK 21Shares | 4 | +$1.20B |
| VanEck | 2 | +$1.01B |
| Grayscale | 7 | -$28.11B |
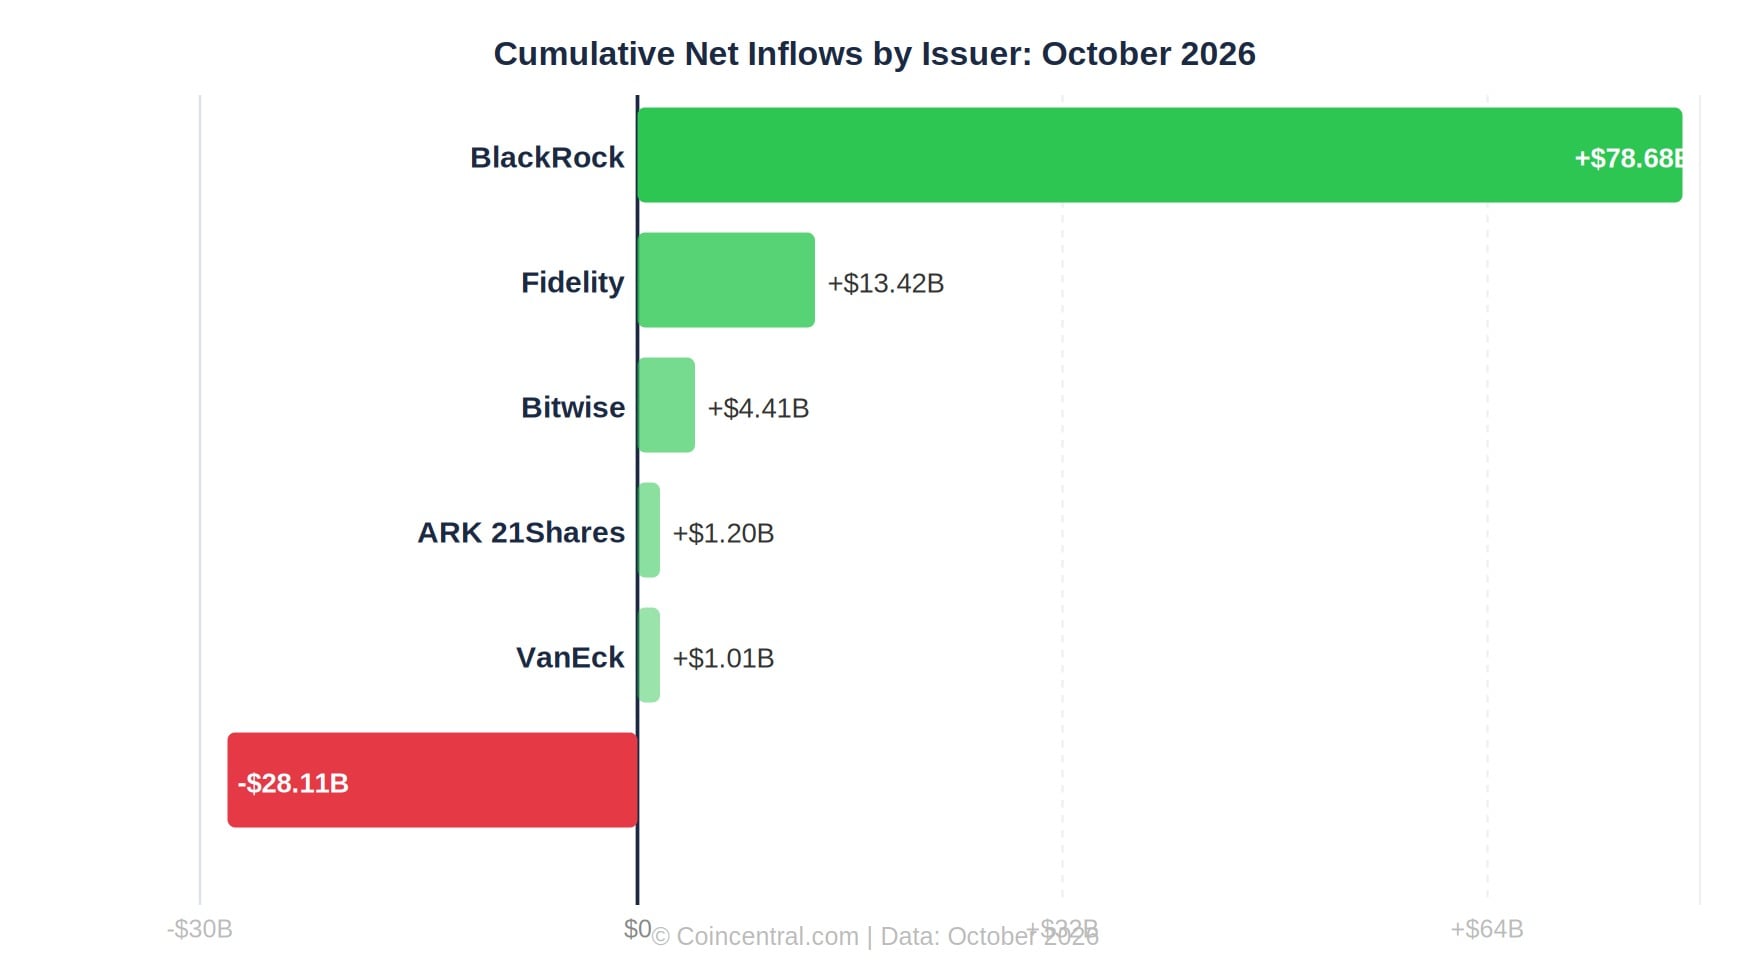
Figure 6: Cumulative Net Inflows by Issuer, October 2026
Expense Ratios: What Investors Are Paying
Fees vary widely across crypto ETFs. The most expensive products are Grayscale’s ETHE at 2.50% and GBTC at 1.50%. Both are legacy products that were converted from trust format to ETF structure without reducing their fee levels.
The cheapest spot Bitcoin ETF by stated rate is Grayscale’s Bitcoin Mini Trust at 0.15%. VanEck’s HODL currently charges 0.00%, though that reflects a fee waiver rather than a permanent rate. Investors should check whether any promotional waiver has an end date before making decisions based solely on the stated figure.
Most major spot Bitcoin ETFs from BlackRock and Fidelity charge 0.25%. ARK 21Shares’ ARKB charges 0.21%, and Bitwise’s BITB charges 0.20%. Franklin Templeton’s EZBC is slightly cheaper at 0.19%.
Spot Ethereum ETFs fall in a similar range. BlackRock’s ETHA and Fidelity’s FETH both charge 0.25%. Bitwise’s ETHW and VanEck’s ETHV both charge 0.20%. Franklin’s EZET charges 0.19%.
The average expense ratio across all 174 US-listed crypto ETFs is 0.83%. That number is pulled higher by older, high-fee products. New spot ETFs are generally priced between 0.15% and 0.25%.
Futures-based ETFs like ProShares’ BITO at 0.95% tend to cost more than spot funds. Part of that cost comes from contract rolling mechanics: as a futures contract expires, it must be replaced with a new one, often at a higher price. This creates a drag on performance that goes beyond the stated annual fee.
| Ticker | Fund | Asset | Type | Exp. Ratio |
|---|---|---|---|---|
| ETHE | Grayscale ETH Staking ETF | ETH | Spot | 2.50% |
| GBTC | Grayscale Bitcoin Trust | BTC | Spot | 1.50% |
| BITO | ProShares Bitcoin ETF | BTC | Futures | 0.95% |
| BTCW | WisdomTree Bitcoin Fund | BTC | Spot | 0.30% |
| IBIT | iShares Bitcoin Trust | BTC | Spot | 0.25% |
| FBTC | Fidelity Bitcoin Fund | BTC | Spot | 0.25% |
| ETHA | iShares Ethereum Trust | ETH | Spot | 0.25% |
| FETH | Fidelity Ethereum Fund | ETH | Spot | 0.25% |
| ARKB | ARK 21Shares Bitcoin ETF | BTC | Spot | 0.21% |
| BITB | Bitwise Bitcoin ETF | BTC | Spot | 0.20% |
| ETHW | Bitwise Ethereum ETF | ETH | Spot | 0.20% |
| EZBC | Franklin Bitcoin ETF | BTC | Spot | 0.19% |
| ETH | Grayscale ETH Mini | ETH | Spot | 0.15% |
| BTC | Grayscale BTC Mini | BTC | Spot | 0.15% |
| HODL | VanEck Bitcoin ETF | BTC | Spot | 0.00%* |
*Fee waiver applied. Standard rate is 0.20%.
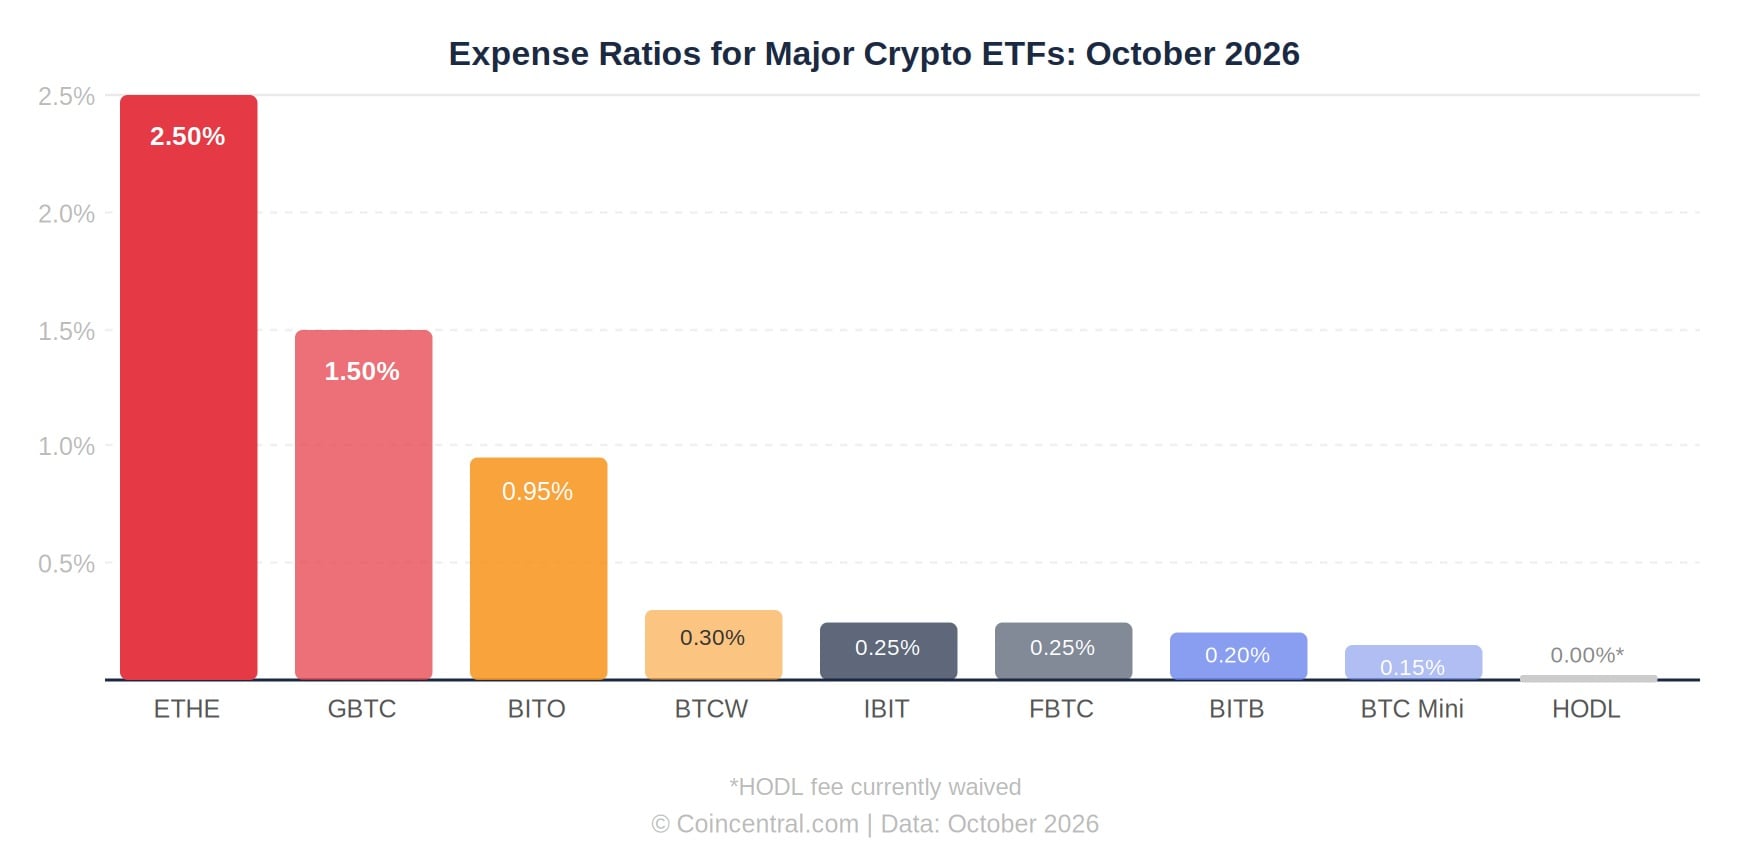
Figure 7: Expense Ratios for Major Crypto ETFs, October 2026
Spot ETFs vs Futures ETFs
Most AUM and most daily trading volume sits in spot ETFs. Spot products directly hold the underlying crypto asset. Futures ETFs hold derivative contracts and must roll those contracts forward as they expire, adding costs beyond the stated fee.
BITO, the ProShares Bitcoin futures ETF, is the largest futures fund with $1.71 billion. That compares to $68.67 billion in IBIT. The gap shows how strongly investor preference has shifted toward spot products since they became available in the US in January 2024.
Futures ETFs suffer from a cost known as roll yield or negative roll. When a futures contract expires, it is replaced with a newer contract, often at a higher price. This eats into returns beyond what the expense ratio alone would suggest, which is one reason performance can lag the spot asset price over time.
Spot ETFs do not have this problem. They hold the actual asset and track its price directly. For long-term investors, the lower total cost of holding a spot ETF makes it a more efficient vehicle than a futures-based equivalent at similar fee levels.
Hong Kong-Listed Crypto ETFs
Three Bitcoin ETFs are listed in Hong Kong: ChinaAMC, Harvest, and Bosera HashKey. Full AUM and flow data for these funds is still being compiled, and the numbers are not directly comparable to US-listed funds at this stage.
Hong Kong’s crypto ETF market is a fraction of the size of the US market. Daily volumes for Hong Kong-listed Bitcoin ETFs run in the low millions, compared to the billions traded on US exchanges during active periods.
Ethereum ETFs are also available in Hong Kong. Combined AUM for all Hong Kong crypto ETFs sits in the hundreds of millions of dollars. The market is growing but trails the US by a wide margin in both total assets and daily liquidity.
The Hong Kong market serves Asia-Pacific investors who want regulated crypto ETF access within their region. Over time this market may grow, but it will likely continue to lag the US given the difference in the size of institutional capital allocated to crypto.
Key Facts at a Glance
Total crypto ETF AUM of $124.77 billion places this market among the largest ETF categories globally. The growth from near zero to over $100 billion took less than two years after US spot Bitcoin ETFs launched in January 2024.
BlackRock’s position is clear in the data. Its two products, IBIT and ETHA, hold more combined assets than all other issuers put together. Grayscale’s persistent outflows show what happens when a high-cost product competes directly with lower-cost alternatives in the same category.
Short-term outflows like those seen on October 7, 2026 are a normal feature of ETF markets. The 30-day figure of +$2.35 billion and the 90-day total of +$9.19 billion both suggest that the longer-term demand picture heading into the fourth quarter of 2026 remained positive.
Sources
- The Block — Spot Bitcoin ETF Flows Data
- Artemis — Spot Bitcoin ETF AUM Data
- Yahoo Finance — ETF Volume Data
- Coinglass — Crypto ETF Flow Tracker
- ETFdb.com — Cryptocurrency ETF List and Expense Ratios
- BlackRock — iShares Bitcoin Trust (IBIT) Fund Page
- Fidelity — Wise Origin Bitcoin Fund (FBTC)
- Grayscale — Fund Overview


