






TLDR
- SUI trades near $0.7606 on November 14, down 4.30% on the day.
- The token sits on an ascending trendline at $0.75–$0.76 after a 40% drop from $1.25.
- Suiet wallet shuts down, and DeFi TVL has fallen to about $391 million.
- Three SUI ETFs hold $36.4 million in total inflows but saw no net flows from November 2 to 12.
- RSI sits at 32.02 and MACD stays negative.
Sui (SUI) traded near $0.7606 on Saturday, November 14. That is a 4.30% drop on the day.
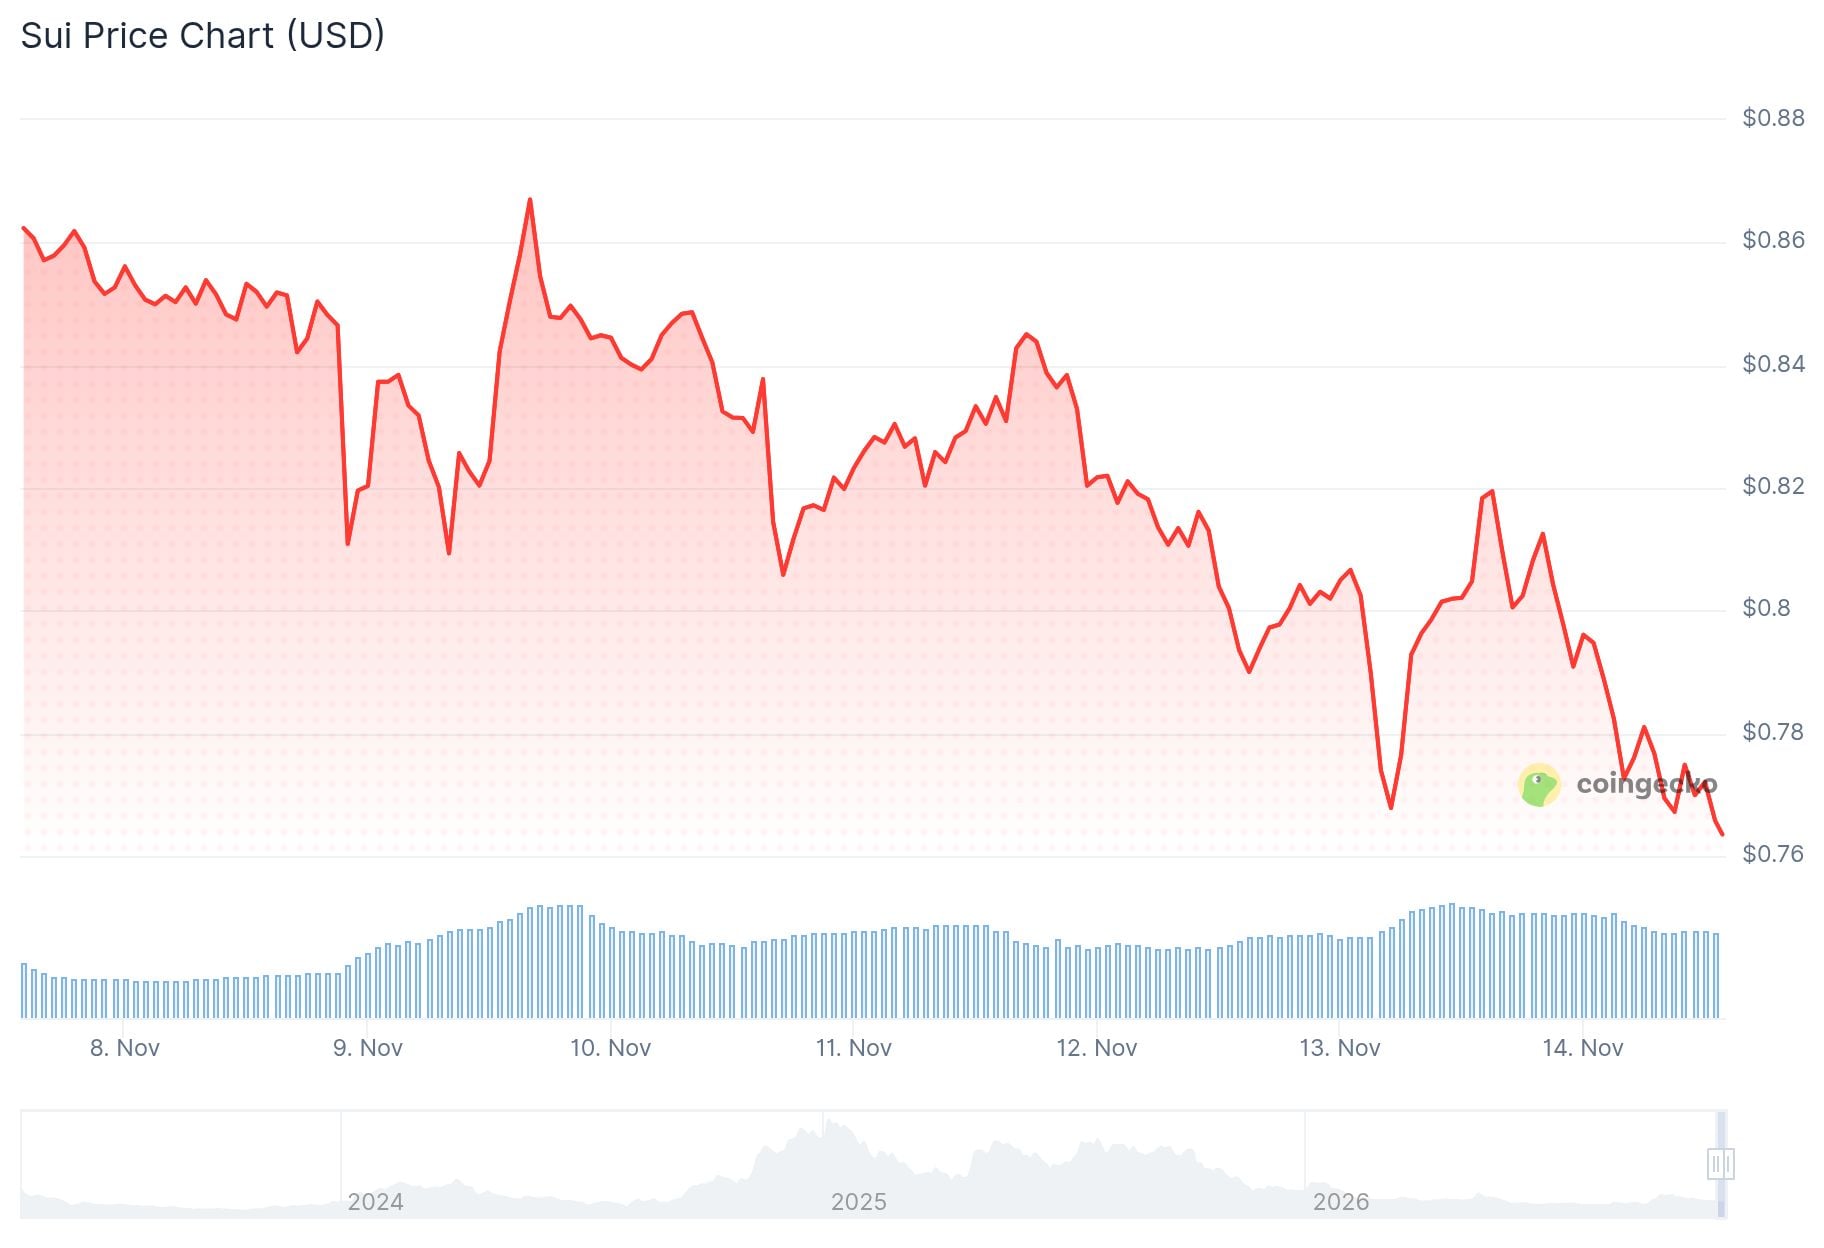
The token has now lost about 40% since its late-September high near $1.25. Price is sitting on an ascending trendline that has held since August.
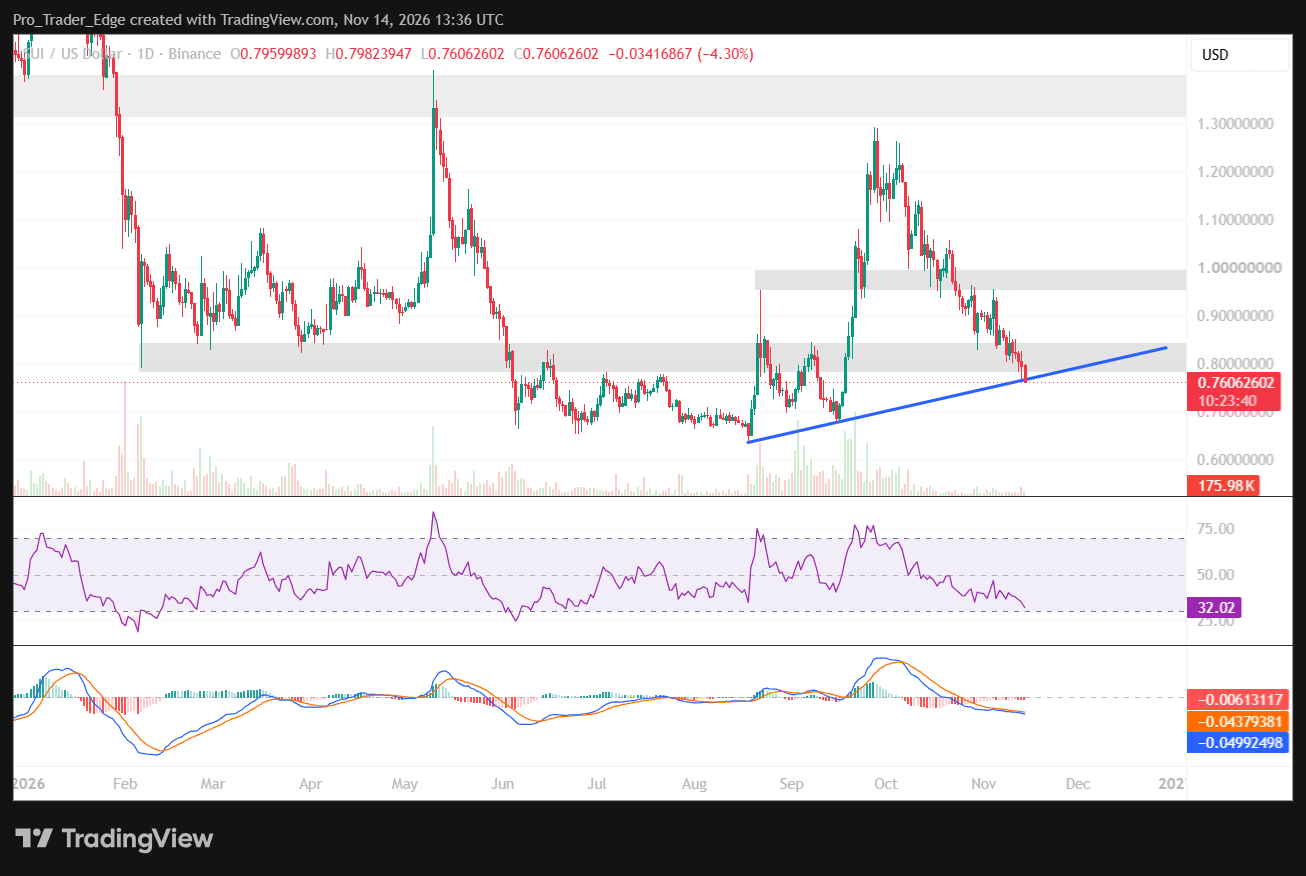
That trendline runs through the $0.75–$0.76 area. Saturday’s intraday low of $0.7606 landed almost exactly on it.
The same zone also marks the lower edge of an older range between $0.75 and $0.84. Buyers have defended this area before.
Suiet Shutdown and Falling DeFi Activity
The weakness comes alongside news from the Sui ecosystem. Suiet, a self-custodial wallet built for the network, will end support and maintenance. Cointelegraph reported on November 11 that its API services stay online only through November 14.
Users were told to back up their recovery information and move to another wallet. Their assets stay on the blockchain.
The shutdown follows the cancellation of the Suiball hardware wallet. That project said it would refund pre-orders.

Network data shows a slower DeFi scene. Total value locked fell more than 22% over the past month, according to the same report. Token Terminal data showed daily active users dropping from about 601,000 in November 2025 to 128,000 in October 2026.
Some building continues. Hashi, a Bitcoin-backed asset project, has started running on Sui’s mainnet.
DefiLlama’s November 14 snapshot shows 92.59 million transactions in 24 hours. The network had 52,380 active addresses in that period.
DEX volume reached about $24.7 million. DeFi TVL slipped 3.42% to roughly $391 million, and seven-day DEX volume fell 10.56%.
Stablecoin supply moved the other way. It rose about 2.5% over seven days to $548 million, with USDC making up more than 69% of it.
ETF Flows and Chart Levels
Sui has several US-listed funds. CryptoETF.today tracks three of them, with $36.4 million in total net inflows. Grayscale’s GSUI holds about $17 million, 21Shares’ TSUI $16.2 million and Canary Capital’s SUIS $3.3 million.
Recent activity has been quiet. The tracker logged no net creations or redemptions across nine sessions from November 2 to November 12. November 13 showed zero inflows, though two funds had not fully reported.
Analyst CryptoBullet pointed to a possible inverse head and shoulders pattern on the SUI daily chart in a post on November 12. The analyst said a breakout from that setup would target $2.2 to $2.5.
What I’m watching closely right now is this potential inverse Head & Shoulders on the $SUI daily chart 👀
🎯 Breakout Target would be $2.2-2.5 pic.twitter.com/OafFjAOTyB
— CryptoBullet (@CryptoBullet1) November 12, 2026
On the daily chart, SUI has printed lower highs and lower lows since it was rejected near $1.25. The August low near $0.63 started the rally that built the trendline.
Overhead, resistance sits at $0.80 and then $0.84. Above that, $0.90 comes first, followed by the $0.95–$1.00 zone where sellers stopped earlier recoveries.
If $0.75 gives way on a daily close, the next support is near $0.70. After that comes the August low at $0.63 and the $0.60 level.
Momentum readings lean toward sellers. The Relative Strength Index is at 32.02, close to the oversold line of 30.
The MACD line is at -0.0499, below its signal line at -0.0438. The histogram reads -0.0061.
A bullish MACD crossover with RSI back above 40 would point to easing sell pressure. A close above $0.84 would be the first sign that buyers are retaking control.
As of Saturday, SUI trades at $0.7606, right on the $0.75–$0.76 trendline zone.


