



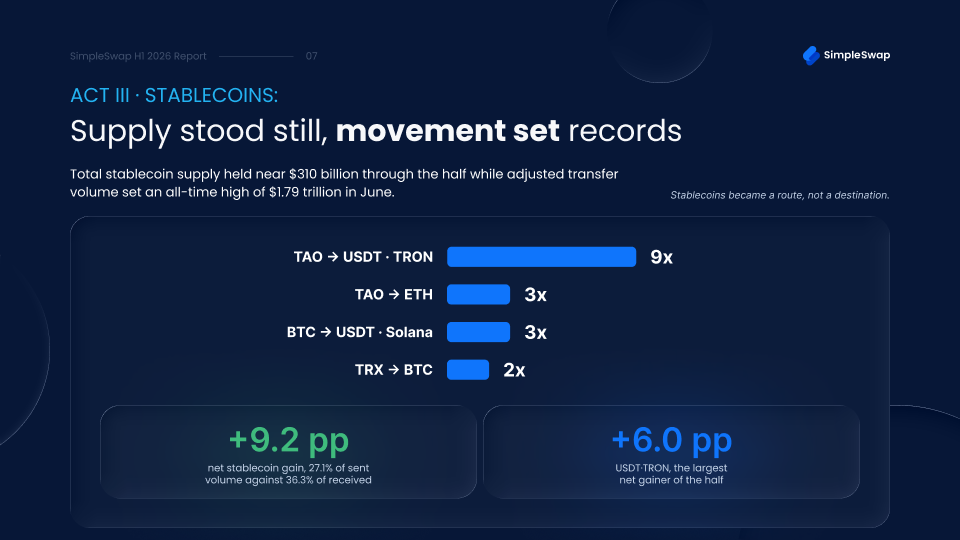


Total stablecoin supply barely changed in the first half of 2026. It ended the first quarter at $309.9 billion and the second at $305.1 billion, a decline of under 2% in a market that lost roughly 30% of its capitalization over the same period. On its own, that makes the segment look like it held steady while everything around it fell.
Settlement says otherwise. Visa’s Allium-powered dashboard recorded $1.79 trillion in adjusted stablecoin transfer volume in June, an all-time high and 125% above the same month a year earlier. The previous record was set in February of the same half. Supply stayed flat while movement set records twice in five months.
That divergence has a simple explanation, and the H1 2026 Swap Report from SimpleSwap provides transaction-level data to support it. The report covers 1 January to 30 June and opens each section with a public benchmark before any platform figures appear, which is why the Visa numbers above come first here as well. Stablecoins are no longer mainly a place to sit. They are increasingly the path between places.
What the swap layer sees
The report comes from SimpleSwap, a self-custodial multi-source swap aggregator, and it measures the point when a user moves from one asset to another. Over the half-year, dollar-pegged assets accounted for 27.1% of sent volume versus 36.3% of received volume, for a net gain of 9.2 percentage points. More money ended a swap in a stablecoin than started one in it, and that was true every month.
The figure’s stability is more interesting than its size. The share of volume flowing into stablecoins never left a band between 53.90% and 60.10%, a total range of 6.2 points over six months. Out of 26 weeks, only two recorded a net outflow.
A number that refuses to swing is not measuring sentiment. It is describing a floor.
One asset did most of the work
The largest net gainer in the report is USDT on the TRON network, up 6.0 points, ahead of every other asset by a wide margin. USDT on Ethereum came second at 2.4 points. Dollar liquidity on a low-cost chain absorbed more inbound volume than anything else on the platform.

That result lines up with what the settlement data implies. If stablecoins were functioning mostly as a defensive position, the cheapest rail would carry no particular advantage, since a position sits still and the cost of movement hardly matters. If they are functioning as transport, the cheap rail wins, because every hop costs something.
The rest of the net balance table reinforces the direction. Ether and Solana both ended the half modestly positive. Bitcoin closed slightly negative at −1.2 points, and Monero recorded the sharpest outflow among assets at −6.2 points. The assets people left were the ones you hold. The asset they arrived at was the one you spent.
Route-level growth points the same way. Two of the half’s four fastest-growing routes ended in a stablecoin on a low-cost chain, with TAO into USDT on TRON growing about 8.5 times and Bitcoin into USDT on Solana about 2.6 times. Both are measured from small bases, so they read as a directional signal about where interest moved rather than as a statement about where the volume sits. The direction is the same one every other figure here points at, since the destination in each case is dollar liquidity somewhere cheap to move from.
Consistency is the unusual part
Most flow metrics in crypto swing hard enough that a six-month average tells you almost nothing. This one did not. Across 26 weeks, the two outflow weeks were the first week of January and the first week of June, and no month in between broke the pattern of net accumulation.
The second of those dates deserves attention, because the first week of June contained the deepest Bitcoin drawdown of the entire half. In the worst week of the period, the supposedly defensive asset recorded money leaving rather than arriving. A parking space does not behave that way during a storm. A corridor does, because traffic through it depends on where people are going rather than on how frightened they are.
The comparison that makes the case
The same report contains a control group of sorts. Its most-discussed finding is that stablecoin flows stopped responding to Bitcoin drawdowns partway through the half. In early February, Bitcoin fell 17.5% over 36 hours, and stablecoin inflows on the platform ran 600% above their weekly average. In early June, Bitcoin fell 15.7% over 70 hours, and the same flows came in 9% below average.
If dollar-pegged assets were primarily a fear trade, that second episode should have produced a spike. It produced nothing. What did not change across those four months was the baseline share, which stayed inside its narrow band throughout. The defensive use faded while the structural use held.
Why this matters beyond one platform
Analysts who track adjusted transfer data attribute the 2026 divergence to payments and the cross-network fund movements rather than trading. The picture at the swap level confirms this: nine out of ten swaps on the platform crossed the network boundary during the reporting period, meaning dollar-pegged assets largely act as a connecting layer between blockchains.
The practical shift is in which question to ask. The total supply volume answers the question of how much capital is “parked” in dollars, but does not say anything about how actively this capital is being used. The volume of settlements with unchanged supply, together with net inflows recurring month-to-month at the swap level, indicates that the asset class has imperceptibly changed its function.
For those who follow the sector, this changes which data release deserves attention. A month in which the supply increased by 3%, but the volume of settlements remained the same, now says something completely different than a month where the supply did not change, and the volume of settlements updated the record — although two years ago only the first case would have made headlines. The first half of 2026 provided the second option twice.
This describes behavior that has already occurred and implies nothing about where any price goes next.
The stablecoin material sits in the third of six sections. The others cover the contraction in swap volume against a spot market that roughly halved; the rotation out of Bitcoin at the swap layer while dominance climbed; the collapse of the fear trade between February and June; the 48-day median wait from listing to first use; and network reach across the half.
About the report
The SimpleSwap H1 2026 Swap Report covers 1 January to 30 June 2026, benchmarked against the second half of 2025. Each section opens with a public market benchmark before any internal figure appears, drawing on CoinGecko for exchange volumes and capitalization, DeFiLlama together with Visa’s Allium-powered dashboard for stablecoin supply and settlement, Alternative.me for sentiment, and LI.FI plus Circle disclosures for cross-chain context. All figures are aggregated across swaps routed through the platform, and nothing in the report identifies a user, an address, or the timing of an individual transaction. Exactly one dollar figure appears in the text, and it is a measurement threshold rather than a platform total. The report describes past market behavior and contains no price forecasts.
Full report and methodology at SimpleSwap blog. Media and analysts can request additional data cuts at marketing@simpleswap.io.
About SimpleSwap
SimpleSwap is a self-custodial multi-source swap aggregator. It draws liquidity from more than 20 CEX and DEX sources, covers 2,800+ assets, and handles provider and route selection under the hood. Over 8 years, 10M+ users have swapped through SimpleSwap, and 6,000+ projects use it as a business solution, including Exodus and Tangem. The only official SimpleSwap website is simpleswap.io.


